Research - Onkologia i Radioterapia ( 2022) Volume 16, Issue 7
A binary logistic regression approach to identify factors affecting extravasation in chemotherapy treatment
Nihar Ranjan Panda1,2, Jitendra Kumar Pati2 and Ruchi Bhuyan1*2Department of mathematics, CV Raman Global University, Bhubaneswar, Odisha, India
Ruchi Bhuyan, IMS & SUM hospital Siksha O Anusandhan University (Deemed to be), Bhubaneswar, Odisha, India, Email: ruchibhuyan@soa.ac.in
Received: 24-Jun-2022, Manuscript No. OAR-22-67574; Accepted: 18-Jul-2022, Pre QC No. OAR-22-67574 (PQ); Editor assigned: 26-Jun-2022, Pre QC No. OAR-22-67574 (PQ); Reviewed: 10-Jul-2022, QC No. OAR-22-67574 (Q); Revised: 12-Jul-2022, Manuscript No. OAR-22-67574 (R); Published: 19-Jul-2022
Abstract
Extravasations exert extra pressure on patients in terms of morbidity, mortality, health care expenses, and quality of life. Hence it is the need of the hour to know about the existing prevalence of extravasations to develop the protocol for the administration of chemotherapy. The main spotlight of the study is to determine the factors that affect extravasations and use these factors to reconstitute the existing mathematical model which can predict the status of extravasation for hospitalized patients who are going through chemotherapy.
Based on the data from a multispecialty hospital in Bhubaneswar, Odisha, a binary Logistic Regression model is fitted to deduce the relationship between independent and dependent variables to detect significant parameters.
The mean age of the patients was 33.17 ± 12. Keeping 5% as the level of significance, we find the parameters namely gender (p=0.043) cannula to articulation (p=0.023), flushing after chemotherapy (p<0.000), and history of extravasation (p<0.000) are very significant. The model is adequate up to 79% on a case-to-case basis by establishing these factors in respect of their variation.
Keywords
Extravasations, logistic regression, chemotherapy
Introduction
Extravasation may occur due to different kind of reason in the patients who receives chemotherapy [1]. This is happening by the cannula piercing the vessel wall or the leakage caused by increasing venous pressure. As per past data suggest 11% of pediatric patients and up to 70% of neonates getting intravenous treatment can get extravasation.
We may say that the risk of getting extravasation is high with peripheral intravenous catheters [2][3]. We can consider some risk factors for extravasation, increased skin and vein fragility, for example, neonates, multiple cannulas, flexible subcutaneous tissue, and chemotherapy. Also, we may consider some other risk factors for extravasation, for example, the inability to report pain. Inability to visualize insertion sites [4].
Extravasation is the procedure where any fluid unintentionally leaks into the nearby tissue. In cancer therapy, extravasation refers to the inadvertent infiltration of chemotherapy into the subcutaneous or sub-dermal tissues surrounding the intravenous or intra-arterial administration site [5][6][7].
RISK FACTORS FOR EXTRAVASATION
Satisfactory recognition of the probable factors for extravasation is important to reduce the danger in some patients. In case of an increased risk of extravasations. Most extravasations can be prohibited with the methodical execution of careful, consistent, evidence-based management techniques. To reduce the risk of extravasations, the staff concerned in the infusion and running of cytotoxic drugs must be skilled to implement some precautionary protocols [4,6,7]. Different studies had been conducted to compare the risk of extravasation in literature [4].We illustrate the difference between patient-related and procedure-related risk factors for extravasation in table 1.
Tab. 1. Comparison between Patient-related and procedure-related risk for extravasation
| Patient-related | Procedure-related | |
|---|---|---|
| There might be the case of Small veins | Due to untrained or less experienced employees. | |
| multiple times previous chemotherapy courses or drugs. | If numerous attempts at cannula occurred. | |
| important but transportable veins (e.g. old people) | in some cases, the cannulation site is not favorable. | |
| identified diseases or situations linked with a changed or impaired movement | It may happen due to Bolus injections. | |
| enlarged vascular permeability | In some cases, High flow pressure is an issue. | |
| Fatness in which tangential venous access is harder. | In some cases using Equipment is an issue. | |
| change in sensation at the place of chemotherapy supervision. | insufficient dressings or deprived cannula fixation. | |
| Extended infusion. | badly fixed CVAD | |
Description of study area and period
This study was carried out at CV Raman global university Bhubaneswar India. The data was collected from a multispecialty hospital in Bhubaneswar. A total of 330 patients were included in this study who received chemotherapy, the demographic variables of the patients were collected and analysed using the spss version 25 program.
Study Design
We have used qualitative as well as quantitative research designs.
Variables Identification
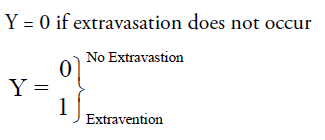
The dependent variable of this study is “extravasation status” which has two binary outcomes if a patient has an extravasation status coded as 1 and if a patient has no extravasation status coded as 0. The predictor variables consider the age of the patient, gender, lifestyle, BMI, BMI category, name of a vein, type of administration, cannula to articulation, after the flush, before the flush, and history of extravasation in table 2&3.
Tab. 2. Description of variables
| Data | Types of variable | Data Types | Values | |||||
|---|---|---|---|---|---|---|---|---|
| Extravasation status | Dep | Factor | 0 No | |||||
| 1 yes | ||||||||
| Age | Ind | Continuous | ||||||
| Gender | Ind | Factor | 1 Male | |||||
| 2 Female | ||||||||
| Bmi | Ind | Continuous | ||||||
| Lifestyle | Ind | Factor | 1 Sedentary | |||||
| 2 Nonsedentary | ||||||||
| Bmi category | Ind | Factor | 0 No obese | |||||
| 1 Obese | ||||||||
| Name of vein | Ind | Factor | 1 Major | |||||
| 2 Minor | ||||||||
| Type of administration | Ind | Factor | 1 other | |||||
| 2 iv infusion | ||||||||
| Cannula to articulation | Ind | Factor | 1 Yes | |||||
| 2 No | ||||||||
| After flush | Ind | Factor | 1 Yes | |||||
| 2 No | ||||||||
| Before flush | Ind | Factor | 1 Yes | |||||
| 2 No | ||||||||
| History of Extravasation | Ind | Factor | 1 yes | |||||
| 2 No | ||||||||
Tab. 3. Descriptive statistics of the variables
| Variables | N | Percent | Total |
|---|---|---|---|
| Gender | |||
| Male | 194 | 58.8 | |
| Female | 136 | 41.2 | 330 |
| Lifestyle | |||
| sedentary | 205 | 62.1 | |
| Non sedentary | 125 | 37.9 | 330 |
| Bmi category | |||
| No obese | 290 | 87.9 | |
| Obese | 40 | 12.1 | 330 |
| Name of vein | |||
| Major | 305 | 92.4 | |
| Minor | 25 | 7.6 | 330 |
| Type of administration | |||
| iv infusion | 291 | 88.2 | |
| other | 39 | 11.8 | 330 |
| Cannula to articulation | |||
| Yes | 67 | 20.3 | |
| No | 263 | 79.7 | 330 |
| After flush | |||
| Yes | 271 | 82.1 | |
| No | 59 | 17.9 | 330 |
| Before flush | |||
| Yes | 257 | 77.9 | |
| No | 73 | 22.1 | 330 |
| History of Extravasation | |||
| Yes | 58 | 14.6 | |
| No | 272 | 82.4 | 330 |
Assumptions of Binary logistic Regression (BLR) model
The characteristic of the BLR model is that the dependent variable only takes on two possible outcomes [8,9,10]. The characteristics of the BLR model are based on independent observations [11]. Multicollinearity is having a bad impact on the logistic regression model, so the characteristic of the BLR model is that a high degree of correlation between the variables is not preferred [12, 13, 14]. Multicollinearity occurs when two or more explanatory variables are highly correlated to each other. In the case of high degree correlation, there is a difficulty for fitting and interpretation of the model. The BLR model is having no extreme outliers, which affects the results of the relevant model. A linear relationship occurs between each variable and the logit of the response variable. [15, 16 17]
Logistic Regression model
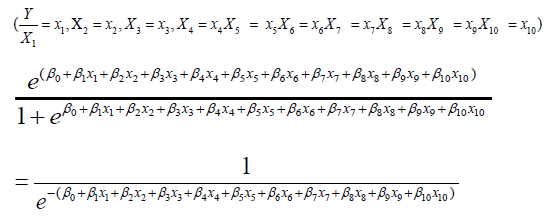
The concerned model has a little bit of resemblance with the regression equation. In the case of having one predictor variableX1, the logistic regression equation gives a probability of Y as,
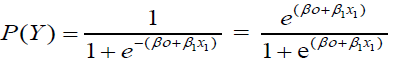
The extension of this equation may include several predictors. In the case of several predictors we have,
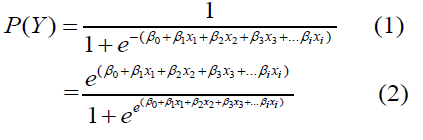
Where β0,β1,β2,βi are the coefficients of a regression equation? And x0,x1,x2,xiare the independent variables in the given equation.
The above two equations are the same. The linear combination has been extended for any number of predictors.
The Binary Logistic Regression Model
In a logistic regression model, if the dependent variable is categorized into two parts with binary indicator variables 0 and 1 like “yes” or “no”, we apply the logistic regression model.
We can divide the independent variable of the logistic model into 2 types.
• Continuous Variables: it assumes any value within a specified range in the data set.
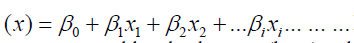
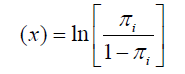
• Discrete Variable: It assumes only certain values. Introducing a “link function” that links the Dependent variable and independent variable of the predictor variable xi. The link function (x) allows the response variable to be modelled as:
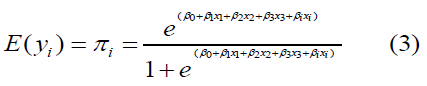
where πi is defined as the probability that the response variable y = 1, β0 is defined as the constant, and β0 is defined the coefficient of the predictor variable xi. The link function allows the response variable to be modelled as:
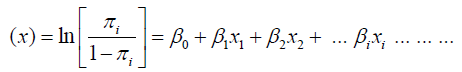
 For a given binomial response variable, the logistic (logit) a link is defined as the natural logarithm of the odds ratio:
Hence we can easily solve the logistic regression model as:
Using data and with the help of maximum likelihood techniques, we find out the equation with intercept (constant) β0and variable coefficients βi.
To obtain the significance of the coefficient of a logistic regression model, we may use the wald statistic test and the likelihood ratio test.

Here ^ βis defined as the estimated coefficient β and s.(β) is defined as its standard error.
We define the G statistic as the likelihood ratio test for the overall significance of the beta's coefficients for the independent variables as
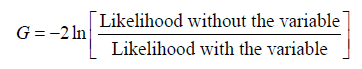
For fitness of the model we use likelihood statistic L. Using the concept of the null hypothesis with a view that all the regression coefficient of the model is zero, we may say the p-value takes measure roll for checking the variables as significant.
Basically, to check the goodness of fit of the logistic regression model we use the Hosmer and Lemeshow method. The method was mainly based on the value of estimated probabilities.
We also make a test by using Pearson x2 statistic from observed and expected frequencies as,
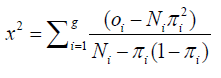
Where Ni Is defined as the number of observations in the ith group. Oi is defined as the number of event outcomes in the ith group. πi Is defined as the average estimated probability of an event outcome for the ith group.
Odds ratio
The odds ratio plays a vital role in the logistic regression, model [18]. This is the measure of association for the 2×2 contingency table.π1 is the probability of success in row 1 and π2 in row 2[18, 19]. Within row 1, the odds of success are defined to be:
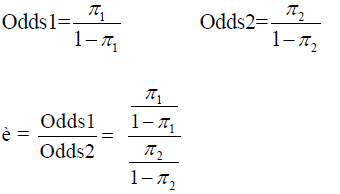
For the binary regression model, the odds ratio is the exponent e(βi) is the ratio of odds for a one-unit change in one variable. When the two groups of odds are identical then the odds ratio is equal to one.
Data and method of analysis
A simple random sampling method was used to collect the data in the hospital, which is located in Bhubaneswar Odisha.
The outcomes are: Y = 1 if extravasation occurs
As per calculation, we obtain:
•From the table 4, the odds ratio for age is 1.006.
Tab. 4. Association of independent variables with the status of extravasation
| Variables | B | S.E | Wald | df | Sig | Exp (B) |
|---|---|---|---|---|---|---|
| Age | 6 | 0.008 | 0.602 | 1 | 0.431 | 1.006 |
| Gender | -0.55 | 0.284 | 3.742 | 1 | 0.043 | 0.557 |
| Life style | 0.081 | 0.297 | 0.074 | 1 | 0.785 | 1.084 |
| Bmi | 0.033 | 0.039 | 0.696 | 1 | 0.404 | 1.033 |
| Bmicatagory | -0.198 | 0.558 | 0.125 | 1 | 0.723 | 0.821 |
| Name of vein | -0.572 | 0.485 | 1.391 | 1 | 0.238 | 0.564 |
| Types of administration | 0.434 | 0.429 | 1.024 | 1 | 0.312 | 1.543 |
| cannula to articulation | 0.775 | 0.34 | 5.2 | 1 | 0.023 | 2.171 |
| Past history of Extravasation | 2.647 | 0.421 | 39.468 | 1 | 0 | 14.149 |
| before flush | 0.162 | 0.352 | 0.352 | 1 | 0.646 | 1.175 |
| after flush | -1.311 | 0.376 | 0.376 | 1 | 0 | 0.269 |
| Constant | -4.474 | -0.474 | 1.222 | 1 | 0.698 | 0.622 |
•From the table 4, the odds ratio for gender is 0.557.
•From the table 4, the odds ratio for lifestyle is 1.084
•From the table 4, the odds ratio for bmi is 1.033.
•From the table 4, the odds ratio for bmi category is 0.821 and so on.
•From the table4, the odds ratio for past history of extravasations is 14.149.
Here we can say that the covariates cannula to articulation, history of extravasation, and flushing after chemotherapy are statistically significant, while the covariate's age, BMI, gender, name of the vein, etc. are not significant factors.
The corresponding logit is
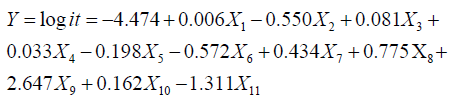
In other words, we can write
Y=logit= -4.474+0.006(age).550(gender)+0.081(lifestyle)+0.0 33(Bmi)0.198(bmicat)−0.572(Name of the vein)+0.434(Types of administration)+.775(cannula to articulation)+2.647(History of Extravasation)+0.162(before flush)−1.311 (after flush)
There is a non-linear relationship between outcome and predictor variables From table 5:
Tab. 5. Classification matrix based on logistic regression model
| Observed | Predicted | ||
|---|---|---|---|
| Extravasation Status | No | Yes | Percentage |
| No | 194 | 16 | 92.4 |
| Yes | 54 | 66 | 55 |
| Overall Percentage | 78.8 | ||
a.92.4% of the patients had not extravasation correctly classified and 7.6% were incorrectly classified.
b.55% of the patients having extravasation were correctly classified, 45%of the cases were not classified correctly.
c.The model is quite good and reliable because the total correct percentage was 78.8%.
From Table 6, we can say that the value of Cox & Snell R Square indicates 46.6% of the variation in the model. From the table 6, Nagelkerke R Square indicates a moderately strong relationship of 56.3% between the predictors and the prediction.
Tab. 6. Model summary based on logistic regression model
| Step | -2 Log likelihood | Cox & Snell R Square | Nagelkerke R Square |
|---|---|---|---|
| 1 | 330.79 | .466 | .563 |
From the table 7, the value of the Hosmer Lemeshow goodnessof-fit statistic for the full model was Chi-square=5.694 and the p-value from the chi-square distribution with 8 degrees of freedom is 0.682. This value indicates that the p-value of chisquare is not significant, which is good for our model.
Tab. 7. Hosmer and Lemeshow Test
| Step | Chi-square value | Degrees of freedom | significance |
|---|---|---|---|
| 1 | 5.694 | 8 | .682 |
Discussions of Findings
Based on the observations regarding the model, we herewith conclude that the Model is effective in correlating the parameters with a 5% level of significance. Increasing the level of significance to 10% we recommend there is a possibility of increasing the significant factors. In our future work, the logistic regression curve may be analyzed concerning Points of inflections extremum correlating with the significant factors. so overall the model is recommended for the state of extravasation up to a 5% level of significance.
References
- European Oncology Nursing Society (EONS). Extravasation Guidelines 2007
- Wengström Y, Margulies A. European oncology nursing society extravasation guidelines. Eur J Oncol Nurs.2008;12:357-361.
- Langer SW, Sehested M, Jensen PB. Anthracycline extravasation: a comprehensive review of experimental and clinical treatments. Tumori J.2009;95:273-282.
- Tsavaris NB, Karagiaouris P, Tzannou I, Komitsopoulou P, Bacoyiannis C, et al. Conservative approach to the treatment of chemotherapy‐induced extravasation. J dermatol surg oncol. 1990;16:519-522.
- Langer SW, Thougaard AV, Sehested M, Jensen PB. Treatment of experimental extravasation of amrubicin, liposomal doxorubicin, and mitoxantrone with dexrazoxane. Cancer chemother pharmacol. 2012;69:573-576.
- Kerker B, Hood A. Chemotherapy-induced cutaneous reactions.Semin Dermatol.1989;8:173–181.
[Google Scholar] [CrossRef]
- Abdulqader Qm. Comparison of discriminant analysis and logistic regression analysis: An application on caesarean births and natural births data. Yuz Yıl Univ J Sci Inst.2015;20:34-46.
[Google Scholar] [CrossRef]
- Cabrera AF. Logistic regression analysis in higher education: An applied perspective. Higher education: Handbook of theory and research.1994;10:225-256.
[Google Scholar] [CrossRef]
- Ahani E, Abass O, Okafor Ray O. Application of Logistic Regression Model to Graduating CGPA of University Graduates.J Mod Math Stat.2010;4 :62.
- Hauck Jr WW, Donner A. Wald's test as applied to hypotheses in logit analysis. J am stat assoc.1977;72:851-853.
- Jennings DE. Judging inference adequacy in logistic regression. J. Am. Stat. Assoc.1986;81:471-476.
- Hair JF, Black WC, Babin BJ, Anderson RE. Multivariate data analysis. Seven Editions.
[Google Scholar] [CrossRef]
- Lei PW, Koehly LM. Linear discriminant analysis versus logistic regression: A comparison of classification errors in the two-group case. J Exp Educ. 2003;72:25-49.
- Venables WN, Ripley BD. Modern applied statistics with S. Fourth edition. Springer N Y.2022
- Hosmer, D. W., Lemeshow, S. & Sturdivant, R.X. Applied Logistic Regression 3rd Edition. West Point,The United States of America. Wiley Intersci. Publ. 2013.
- Agresti A. An introduction to categorical data analysis. John Wiley Sons.2018.
[Google Scholar] [CrossRef]
- Hosmer DW, Lemeshow S. Applied logistic regression.(John Wiley & Sons, Inc.: New York).
- Menard S. Applied logistic regression analysis. Sage; 2002.
- Menard S. Coefficients of determination for multiple logistic regression analysis. Am. Stat. 2000;54:17-24.


