Research Article - Onkologia i Radioterapia ( 2023) Volume 17, Issue 11
A study of the relationship between radioactive hazard and soil geology at the university of Kufa, college of science, Iraq
Ali Jaafar Azeez1, Shaymaa Awad Kadhim1*, Faris Nasir Murad2, Hisham Abbas Hadi Alhoseni3, Layth Yousif Jebur3, Ali Anwar Abdul Amir1, Haneen Fadel Hashem1 and Murtadha Hussain Hassan32Department of Geology, University of Kufa, Najaf, Iraq
3Department of Radiology Techniques, The Islamic University, Najaf, Iraq
Shaymaa Awad Kadhim, Department of Physics, University of Kufa, Najaf, Iraq, Tel: 4967840007512, Email: shaymaa.alshebly@uokufa.edu.iq
Received: 07-May-2023, Manuscript No. OAR-22-98041; , Pre QC No. OAR-22-98041 (PQ); Editor assigned: 10-May-2023, Pre QC No. OAR-22-98041 (PQ); Reviewed: 24-May-2023, QC No. OAR-22-98041; Revised: 25-Aug-2023, Manuscript No. OAR-22-98041 (R); Published: 01-Sep-2023
Abstract
Investigation of soil radioactivity levels for faculty science at the university of Kufa is a critical topic due to the importance of the fact that its employees are of different categories of people. Twenty samples of soils were picked up from the study area and the specific activity of the 232Th, 226Ra and 40K nuclei was measured by a gamma ray spectrometer system connected with the NaI detector. The values various from (23.851-3.863) Bq/kg with mean (12.598 Bq/kg) to 226Ra, (3.757-15.164) Bq/kg with average (7.884 Bq/kg) to 232Th and (152.125- 447.822) Bq/kg with mean (238.355 Bq/kg) to 40K. The 40K concentrations have a significant specific activity value more than uranium and thorium concentrations. The equivalent activity of radium, outdoor and indoor absorbed doses, and external and internal hazard indices are also calculated; their values, with the exception of one indoor absorbed dose value, were all below the allowed limits. Excess Life time Cancer Risk (ELCR) associated with the equivalent Effective Annual Dose (EADE) was also calculated, as its value was (0.554 × 10⁻³) less than the internationally permissible limits (1.45 × 10⁻³), which indicates that the studied area is healthy and as an indicator for future studies, the radioactive map of the activity of the three nuclides was also drawn with a program surfer 13.
Keywords
NORMs; Soil samples; Gamma spectroscopy; EADE; ELCR
Introduction
The earth’s crust has three natural radionuclides these are: U-238, Th-232 and K-40. Environmental radionuclides typically come from two sources: (The first of the 238U series and 232Th) and the second from originating in human activity sources (137Cs), such as power production and military processes like weapons experiments or accidents of nuclear, these radionuclides may be discharged into the environment [1]. It is crucial to research radionuclide distribution, characteristics, and environmental impact. Due to the release of ionizing radiation, radionuclides such as uranium, thorium, and decay products could be hazardous to human health [2]. To control the amount of the activity of natural background that changes over time and preserve the environment, another study was done it found some radiation variables and quantify the natural radioactivity in different soil samples in Najla city [3].
The radiation level is determined by the concentration of radionuclides in the earth's crust, which varies across the globe. Radionuclide concentrations in the substratum are typically correlated with soil radionuclide concentrations that occur naturally. The radionuclide concentrations of plants are due to soil radionuclide concentrations as linearly linked (ultra microelements) [4].
If phosphoric fertilizers are used, the agro natural ecosystem's background levels can be raised. The concentrations of naturally occurring radioactive materials (F.O.R.Ms) in fertilizers of phosphorus enable be ten times greater or similar to the mean amounts in the soil. These fertilizers expose people to increased levels of contamination throughout their production, transportation, storage and usage. Limiting values (NORMs) concentrations in fertilizers is consequently necessary [5].
The, U and K of earth enter the human body during the food series, primarily for feeding. These elements are absorbed by plants through their roots and build up in plant portions that are consumed. Humans receive an internal radiation dose from the accumulating radionuclides when these plants are processed and consumed [6].
This study aims to evaluate the levels of natural radioactivity, the equivalent activity of radium, and indicators of internal-external radioactive hazards in the soil of the Kufa faculty of science. The information collected in the study area will serve as background information for the natural radioactivity of the soil and is capable to use for future research in the field.
Site of the study area
Najaf governorate is site in the southwestern of Iraq, 161 km from the capital, Baghdad. Study area site between longitudes 44°22`08`` east and 44°22`14`` east and between latitudes 32°01`43`` north and 32°01`26`` north. The study area has different soil that consists of a mix of sand and a variety of grain sizes from very coarse to mud. The area of the Najaf governorate is 28,822 square kilometers distributed over ten administrative units that include three regions and seven sub districts (Figure 1). Desert soil is low in organic matter due to the lack of natural vegetation cover and its deterioration under the conditions of hot weather in the desert and the lack of precipitation on it. It did not undergo a process of washing and purifying minerals [7].
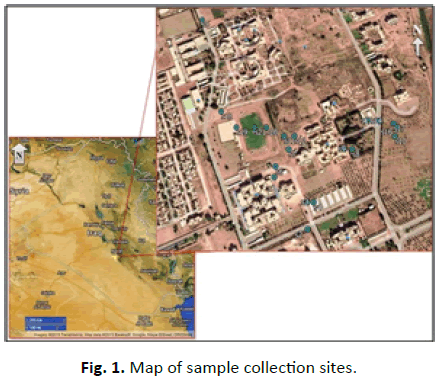
Figure 1: Map of sample collection sites.
Materials and Methods
The sampling spots were located using the Global Positioning System (GPS), as shown in Table 1 coordinates for latitude and longitude. Additionally, the sample collection was done in June 2022. 1 kilogram of soil samples weighing between 5 and 10 cm deep were physically collected, stored in elastic bags, and taking to the physics lab at the University of Kufa's faculty of science. After removing contaminants such rocks, plant roots and leaves, the samples were prepared for measurement. After drying by being exposed to air and oven at 80°C to completely remove the humidity, the samples were given a constant weight and then ground and put in a sieve with a mesh size of 250 [8]. The materials were then placed securely in a 1 liter polyethylene Marinelli beaker. The samples were held in storage for two months to achieve equilibrium between the radium (226Ra and 228Ra) nuclei and their daughters. The radioactivity of naturally existing radioactive nuclei was assessed in soil samples using the (Ortec-digi BASE gamma ray) spectrometer at the 6.8 percent resolution of energy in 662keV of 137Cs. ScintiVisionTM-32 software was set up on the computer for data processing, and the system's energy and efficiency were calibrated [9]. The measurement period lasted three hours. At energies of 1460keV to 40K, 1764keV to 214Bi and 2614keV to 208Tl, respectively, the nuclei of 226Ra, 232Th and 226Ra were measured.
| S. no. | Sample cod | Geographical coordinates | |
|---|---|---|---|
| Longitude | Latitude | ||
| 1 | D1 | 44° 22' 20.2112" E | 32° 1' 35.1592' N |
| 2 | D2 | 44° 22' 23.8962" E | 32° 1' 35.8284' N |
| 3 | D3 | 44° 22' 23.8962" E | 32° 1' 35.8284' N |
| 4 | D4 | 44° 22' 24.5964" E | 32° 1' 33.9211' N |
| 5 | D5 | 44° 22' 10.587" E | 32° 1' 29.4686' N |
| 6 | D6 | 44° 22' 20.343" E | 32° 1' 28.5928' N |
| 7 | D7 | 44° 22' 21.8615" E | 32° 1' 29.6674' N |
| 8 | D8 | 44° 22' 29.2109" E | 32° 1' 33.9589' N |
| 9 | D9 | 44° 22' 28.2778" E | 32° 1' 36.3943' N |
| 10 | D10 | 44° 22' 34.3297" E | 32° 1' 35.495' N |
| 11 | D11 | 44° 22' 21.2855" E | 32° 1' 36.6326' N |
| 12 | D12 | 44° 22' 22.535" E | 32° 1' 36.9818' N |
| 13 | D13 | 44° 22' 31.3738" E | 32° 1' 35.7661' N |
| 14 | D14 | 44° 22' 32.5938" E | 32° 1' 34.7315' N |
| 15 | D15 | 44° 22' 32.6424" E | 32° 1' 34.451' N |
| 16 | D16 | 44° 22' 34.6735" E | 32° 1' 34.6404' N |
| 17 | D17 | 44° 22' 34.3297" E | 32° 1' 35.495' N |
| 18 | D18 | 44° 22' 13.7554" E | 32° 1' 38.6969' N |
| 19 | D19 | 44° 22' 15.6551" E | 32° 1' 35.6585' N |
| 20 | D20 | 44° 22' 19.2133" E | 32° 1' 36.241' N |
Tab. 1. Coordination of samples.
Computations
Equation 1 was used to get the specific activity in Bq/kg units for each particular isotope:

Where εɣ are the Iɣ ray's detection and emission probabilities, t is the counting time and ms is the sample's mass in kg. An is the specific activity of each radionuclide in Bq/kg. Cb is the count rate for background, Cn is the count rate for a sample in counts per second [10].
The combined radiological impacts of the nuclei of 40K, 226Ra and 232Th were compared using a common factor because their distribution in rocks and soil is not uniform. The radium equivalent activity is a measure of this component (Raeq).The organization for economic cooperation and development's suggestion [11]. Less than 370Bq/kg should be the maximum permitted radium equivalent activity values for safe use. Calculating the radium equivalent activity (Raeq) was done using equation 2 [12].

Where (ARa, ATh and Ak) are the specific activity of (226Ra, 232Th and 40K) respectively.
The external (Hex) and internal (Hin). Equations 3 and 4 were used to calculate the danger indices [13].

Radioactivity may harm the population if the calculated values of the indices are larger than unity.
The outdoor dosage (Dout) was calculated using Equation 5 and the average value is 51 nGy/h as recommended by the UNSCEAR report from 2000.

While equation 6 was used to determine the indoor absorbed dose rate for soil samples [14].

70 nGy/h is the acceptable indoor absorbed dosage rate [15].
Results and Discussion
In addition to their ratios, the particular activity values calculated for the 20 soil samples are provided in Table 2.
According to Table 2, the values of 226Ra specific activity for the soil samples employed in this study varied between maximum and minimum values. The highest concentration of a specific uranium activity, 23.850 Bq/kg ± 0.90 Bq/kg, was found in sample D7. The value obtained from sample D11 was 3.86 ± 0.81Bq/kg, which was the lowest. It should be highlighted that sample D11 is located in the earthy soil of the site, which is neither sandy nor suitable for farming. Sample D20 had the highest value (15.16 Bq/kg ± 0.51Bq/kg) for the specific activity of 232Th, whereas sample D5 had the lowest value (3.76 Bq/kg ± 0.34 Bq/kg).
| Samples No. | Specific activity (Bq/kg) | Ratios | ||||
|---|---|---|---|---|---|---|
| 226Ra | 232Th | 40K | Ra/K | Th/K | Th/Ra | |
| S1 | 13.39 ± 1.03 | 7.56 ± 0.34 | 332.94 ± 3.00 | 0.04 | 0.023 | 0.565 |
| S2 | 11.55 ± 0.90 | 8.36 ± 0.33 | 183.72 ± 2.83 | 0.063 | 0.046 | 0.724 |
| S3 | 12.87 ± 1.22 | 6.23 ± 0.43 | 241.10 ± 3.00 | 0.053 | 0.026 | 0.484 |
| S4 | 11.10 ± 0.88 | 7.87 ± 0.34 | 182.36 ± 2.47 | 0.061 | 0.043 | 0.709 |
| S5 | 6.15 ± 1.22 | 3.76 ± 0.34 | 160.08 ± 3.18 | 0.038 | 0.023 | 0.611 |
| S6 | 15.83 ± 0.94 | 6.80 ± 0.38 | 277.23 ± 4.03 | 0.057 | 0.025 | 0.43 |
| S7 | 23.85 ± 0.90 | 15.01 ± 0.34 | 447.82 ± 3.08 | 0.053 | 0.034 | 0.629 |
| S8 | 6.08 ± 1.35 | 5.38 ± 0.40 | 226.78 ± 3.67 | 0.027 | 0.024 | 0.886 |
| S9 | 11.61 ± 1.15 | 10.76 ± 0.36 | 277.72 ± 3.06 | 0.042 | 0.039 | 0.927 |
| S10 | 10.46 ± 1.83 | 4.71 ± 0.60 | 214.48 ± 4.46 | 0.049 | 0.022 | 0.45 |
| S11 | 3.86 ± 0.81 | 5.67 ± 0.31 | 256.22 ± 3.75 | 0.015 | 0.022 | 1.467 |
| S12 | 18.71 ± 1.88 | 9.66 ± 0.66 | 199.80 ± 5.14 | 0.094 | 0.048 | 0.516 |
| S13 | 7.61 ± 1.80 | 7.26 ± 0.48 | 242.29 ± 4.83 | 0.031 | 0.03 | 0.954 |
| S14 | 20.48 ± 1.01 | 13.00 ± 0.31 | 214.92 ± 2.95 | 0.095 | 0.06 | 0.635 |
| S15 | 7.43 ± 1.12 | 6.10 ± 0.42 | 152.12 ± 3.63 | 0.049 | 0.04 | 0.821 |
| S16 | 9.38 ± 1.61 | 6.22 ± 0.67 | 235.88 ± 4.35 | 0.04 | 0.026 | 0.663 |
| S17 | 19.73 ± 2.03 | 5.16 ± 0.54 | 194.40 ± 4.83 | 0.101 | 0.027 | 0.262 |
| S18 | 22.73 ± 0.99 | 8.47 ± 0.33 | 198.66 ± 3.59 | 0.114 | 0.043 | 0.373 |
| S19 | 6.15 ± 0.86 | 4.55 ± 0.32 | 270.42 ± 3.29 | 0.023 | 0.017 | 0.739 |
| S20 | 13.01 ± 1.54 | 15.16 ± 0.51 | 258.16 ± 4.39 | 0.05 | 0.059 | 1.165 |
| MAX | 23.851 | 15.164 | 447.822 | 0.114 | 0.06 | 1.467 |
| MIN | 3.863 | 3.757 | 152.125 | 0.015 | 0.017 | 0.262 |
| Mean | 12.598 | 7.884 | 238.355 | 0.055 | 0.034 | 0.7 |
| Median | 11.58 | 7.029 | 231.329 | 0.05 | 0.028 | 0.649 |
| Standard deviation | 5.91 | 3.319 | 66.326 | 0.027 | 0.013 | 0.283 |
Tab. 2. The concentrations of 226Ra, 232Th and 40K and their ratios in the soil samples under study.
The mean, median and standard deviation of the specific activity of 226Ra are (12.598, 11.580 and 5.910) Bq/kg, while those of 232Th are (7.884, 7.029 and 3.319) Bq/kg, respectively. The specific activity values of uranium and thorium nuclei in all soil samples evaluated for this inquiry were much lower than the UNSCAER-recommended worldwide average (33 Bq/kg for 226Ra and 45 B/q for 232Th).
The measurements of the specific activity of the 40K nucleus ranged from a maximum value of (447.82 Bq/kg ± 3.08 Bq/kg) in sample D7 to a lowest value of (152.12 ± 3.63) Bq/kg) in sample D15, with an average value of (238.355 Bq/kg. (231.329 Bq/kg) and (66.326 Bq/kg) were the median and standard deviation, respectively. Only seven of the twenty samples had specific activity values that were 40K or more above the 420 Bq/kg UNSCAER recommended global average value, while the other values, though lower, are still quite close to the global average. Perhaps as a result of the area's historical use as an agricultural area, the rich soil produced by Euphrates River deposits, the fertilizers found there and the different types of rocks that can be found there.
The special activity caused by the disintegration of the uranium chain is seen in Figures 2 and 3. (226Ra) has a greater specific activity than the thorium chain's average value (232Th). Additionally, we can see that 226Ra and 232Th have specific activity values that are significantly lower than potassium, which has a much higher value. For the goal of comparing the quantities of radionuclides in soil samples, the ratios were used to provide a clear understanding of the relationship between these concentrations. The ratio values in Table 3 show that thorium concentrations are, on average, lower than uranium concentrations (0.034), but both are lower than potassium concentrations (0.055 and 0.034, respectively). Due to the fact that the ratios of Th/K and Ra/K concentrations in soil samples are almost comparable.
| Sample code | Raeq (Bq/kg) | Hex | Dout nGy/h) | Hin | Din (nGy/h) | EADE (mSv/y) | ELCR × 10-3 |
|---|---|---|---|---|---|---|---|
| D1 | 49.833 | 0.135 | 25.037 | 0.171 | 32.548 | 0.1904 | 0.666 |
| D2 | 37.657 | 0.102 | 18.369 | 0.133 | 23.879 | 0.1397 | 0.489 |
| D3 | 40.338 | 0.109 | 19.984 | 0.144 | 25.98 | 0.152 | 0.532 |
| D4 | 36.398 | 0.098 | 17.792 | 0.128 | 23.13 | 0.1353 | 0.474 |
| D5 | 23.849 | 0.064 | 11.997 | 0.081 | 15.596 | 0.0912 | 0.319 |
| D6 | 46.893 | 0.127 | 23.179 | 0.169 | 30.132 | 0.1762 | 0.617 |
| D7 | 79.802 | 0.216 | 39.38 | 0.28 | 51.193 | 0.2994 | 1.048 |
| D8 | 31.234 | 0.084 | 15.909 | 0.101 | 20.681 | 0.121 | 0.423 |
| D9 | 48.385 | 0.131 | 24.024 | 0.162 | 31.232 | 0.1827 | 0.639 |
| D10 | 33.714 | 0.091 | 16.809 | 0.119 | 21.852 | 0.1278 | 0.447 |
| D11 | 31.693 | 0.086 | 16.417 | 0.096 | 21.342 | 0.1248 | 0.437 |
| D12 | 47.913 | 0.129 | 22.977 | 0.18 | 29.871 | 0.1747 | 0.611 |
| D13 | 36.652 | 0.099 | 18.476 | 0.12 | 24.018 | 0.1405 | 0.492 |
| D14 | 55.615 | 0.15 | 26.591 | 0.206 | 34.568 | 0.2022 | 0.708 |
| D15 | 27.858 | 0.075 | 13.749 | 0.095 | 17.873 | 0.1045 | 0.366 |
| D16 | 36.428 | 0.098 | 18.262 | 0.124 | 23.74 | 0.1389 | 0.486 |
| D17 | 42.07 | 0.114 | 20.197 | 0.167 | 26.256 | 0.1536 | 0.537 |
| D18 | 50.132 | 0.135 | 23.852 | 0.197 | 31.008 | 0.1814 | 0.635 |
| D19 | 33.474 | 0.09 | 17.264 | 0.107 | 22.443 | 0.1313 | 0.459 |
| D20 | 54.577 | 0.147 | 26.697 | 0.183 | 34.706 | 0.203 | 0.71 |
| MAX | 79.802 | 0.216 | 39.38 | 0.28 | 51.193 | 0.2994 | 1.048 |
| MIN | 23.849 | 0.064 | 11.997 | 0.081 | 15.596 | 0.0912 | 0.319 |
| Mean | 42.226 | 0.114 | 20.848 | 0.148 | 27.102 | 0.1585 | 0.554 |
| Median | 38.997 | 0.105 | 19.23 | 0.138 | 24.999 | 0.1462 | 0.512 |
| Standard deviation | 12.575 | 0.034 | 6.018 | 0.048 | 7.824 | 0.0458 | 0.16 |
Tab. 3. Computed values of the risk indices for the soil samples under study.
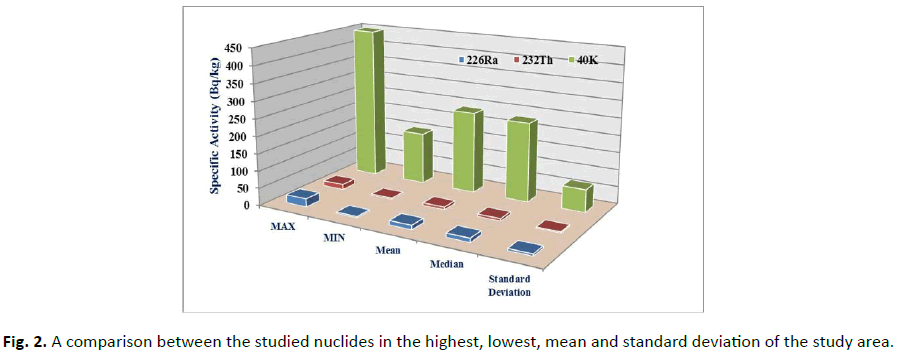
Figure 2: A comparison between the studied nuclides in the highest, lowest, mean and standard deviation of the study area.
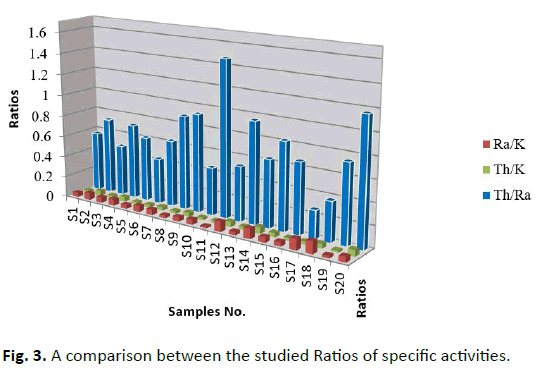
Figure 3: A comparison between the studied Ratios of specific activities.
The daily effective dose per year (Deff)
Equivalent to terrestrial gamma radiation from the outside [16].

While for indoor exposure, by using an occupancy factor of 0.8, the annual effective dose equivalent was:

Where, was the total annual effective dose equal Deff+Deff1=EAED(mSv/y).
Excess Lifetime Cancer Risk (ELCR)
The ELCR is a term used in radiation protection to describe the likelihood or risk that a person exposed to a specific dose of radiation will contract cancer within a given time frame. The annual equivalent dose rate EAED, the fatal Risk Factor (RF) specified by ICRP (0.05 Sv-1) and the local Life Span (LS; 70y) were used to determine the ELCR [17,18]:

In addition, the radium equivalent activity of the soil samples with the highest and lowest results was calculated (79.802 Bq/kg and 23.849 Bq/kg, respectively), with an average value of (42.226 Bq/kg) as shown in Table 3, the computed results were all below the allowable limit (370 Bq/kg) [19,20].
Table 3 displays the derived values for the internal hazard index, indoor dosage, outdoor dose and external hazard index. These variables' greatest values, in descending order, were (0.216, 39.380 nGy/h, 0.280 and 51.193). The projected mean values were 0.114, 20.848 nGy/h, 0.148, and 27.102 nGy/h, while the lowest values were (0.064, 11.997 nGy/h, 0.081 and 15.596 nGy/h), in that order.
The calculated values of the internal and external hazard indices and their means were less than unity despite the fact that the concentration of potassium in the soil sample has increased significantly. Similarly, the mean and values of outdoor absorbed radiation were all below the allowable limit (51 nGy/h). The estimated absorbed dosage values of the average significantly increased as a result of the relative rise in soil potassium concentration. The maximum values of the two variables, Excess Lifetime Cancer Risk (ELCR) and total Annual Effective Dose (EAED), were 0.2994 (mSv/y) and 1.04810-3, respectively. While 0.0912 (mSv/y) and 0.31910-3 were the minimal values, respectively. 0.1585 (mSv/y) and 0.55410-3 were the determined mean values, respectively.
Maps drawing
The research region was radiographic mapped using the golden software surfer 13 program, as seen in Figures 4. A potent 2D and 3D mapping, modeling and analysis program made to help people comprehend geospatial data better. Maps created with Surfer are known for their precision, clarity, and brightness when transforming regularly or irregularly spaced XYZ data into consistent raster grids, as shown in the following Figures 5 and 6 [21,22].
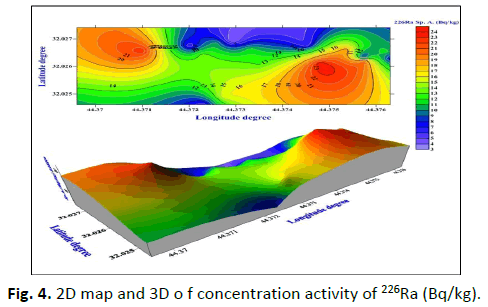
Figure 4: 2D map and 3D o f concentration activity of 226Ra (Bq/kg).
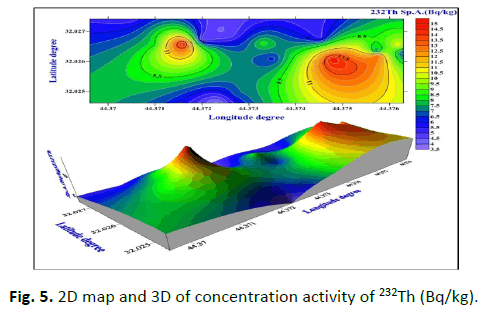
Figure 5: 2D map and 3D of concentration activity of 232Th (Bq/kg).
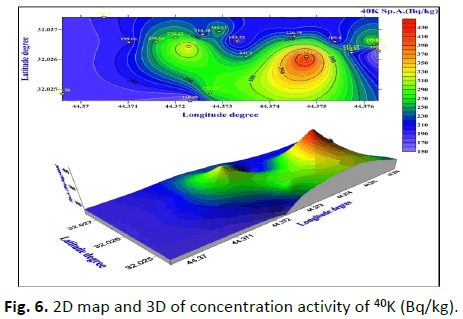
Figure 6: 2D map and 3D of concentration activity of 40K (Bq/kg).
Conclusion
While uranium and thorium concentrations in this area are low in comparison to other nations in the world, potassium concentrations in the soil have increased significantly. This may be the case because just one sample, D7, has an absorbed dose that is higher than the permitted level and all risk indicator values are below the legal limits. Therefore, it is possible to state that the soil of the college of science, University of Kufa, is radioactively safe and does not pose a risk to workers in or around it given the total Annual Effective Dose (EAED) and Excess Lifetime Cancer Risk (ELCR), which were less than the internationally permissible limits.
Acknowledgments
For the purpose of this study, the department of physics, college of science, university of Kufa, Iraq, supplied research facilities that were prepared to assist the local population and conduct studies that contributed to the growth of science.
References
- Michels NA.Newer anatomy of the liver and its variant blood supply and collateral circulation. Am. J. Surg.1966; 112:337–347.
[Crossref] [Google Scholar] [PubMed]
- Tawalbeh AA, Samat SB, Yasir MS. Radionuclides level and its radiation hazard index in some drinks consumed in the central zone of Malaysia. Sains. Malays. 2013; 42:319-323.
- Hamidalddin SH. Determination of agriculture soil primordial radionuclide concentrations in Um Hablayn, north Jeddah west of Saudi Arabia. Int. J. Curr. Microbiol. Appl. Sci. 2014; 3:623-633.
- Makki NF, Kadhim SA, Alasadi AH, Almayahi BA. Natural radioactivity measurements in different regions in Najaf city, Iraq. J. Comput. Sci. Technol. 2014; 9:286-289.
- Efremova M, Izosimova A. 36 contamination of agricultural soils with radionuclides. CSD Uppsala, Uppsala University. 2012.
- Jibiri NN, Farai IP, Alausa SK. Activity concentrations of 226Ra, 228Th, and 40K in different food crops from a high background radiation area in Bitsichi, Jos Plateau, Nigeria. Radiat. Environ. Biophys. 2007; 46:53-59.
[Crossref] [Google Scholar] [PubMed]
- Chakraborty SR, Azim R, Rahman AR, Sarker R. Radioactivity concentrations in soil and transfer factors of radionuclides from soil to grass and plants in the Chittagong city of Bangladesh. J Phys Sci 2013; 24:95.
- Al-Helaly MH, Alwan IA, Al-Hameedawi AN. Land covers monitoring for Bahar-Al-Najaf (Iraq) based on sentinel-2 imagery. J. Phys. Conf. Ser. 2021; 1973:012189.
- Hamza ZM, Kadhim SA, Hussein HH. Assessment the norms for agricultural soils in Ghammas town, Iraq. Plant. Archives. 2019; 19:1483-1490.
- Hussain H, Hussain R, Yousef R, Shamkhi Q. Natural radioactivity of some local building materials in the middle Euphrates of Iraq. J. Radioanal. Nucl. Chem. 2010; 284:43-47.
- Abbas HH, Kadhim SA, Alhous SF, Hussein HH, Al-Temimei FA, et al. Radiation risk among children due to natural radioactivity in breakfast cereals. Nat. Environ. Pollut. Technol. 2023; 22:527-533.
- Amrani D, Tahtat M. Natural radioactivity in Algerian building materials. Appl. Radiat. Isot. 2001; 54:687-689.
- Alhous SF. Measuring the level of radioactive contamination of selected samples of sugar and salt available in the local markets in Najaf governorate/Iraq. In IOP conference series: Materials science and engineering. 2020. IOP publishing.
- Agbalagba EO, Onoja RA. Evaluation of natural radioactivity in soil, sediment and water samples of Niger Delta (Biseni) flood plain lakes, Nigeria. J. Environ. Radioact. 2011; 102:667-671.
[Crossref] [Google Scholar] [PubMed]
- Tzortzis M, Tsertos H, Christofides S, Christodoulides G. Gamma radiation measurements and dose rates in commercially used natural tiling rocks (granites). J. Environ. Radioact. 2003; 70:223-235.
[Crossref] [Google Scholar] [PubMed]
- Rangaswamy DR, Srinivasa E, Srilatha MC, Sannappa J. Measurement of terrestrial gamma radiation dose and evaluation of annual effective dose in Shimoga district of Karnataka state, India. Rad. Prot. Env. 2015; 38:154.
- Alhous SF. Calculation of radioactivity levels for various soil samples of Karbala-Najaf road (Ya-Hussein)/Iraq. In IOP conference series: Materials science and engineering. IOP publishing. 2020.
- Sherafat B, Rashidi A, Lee YC, Ahn CR. A hybrid kinematic acoustic system for automated activity detection of construction equipment. Sensors. 2019; 19:4286.
[Crossref] [Google Scholar] [PubMed]
- Salman AY. Study the contamination of radioactivity levels of 226Ra, 232Th and 40K in (water) Iraq and their potential radiological risk to human population. In IOP conference series: Materials science and engineering. IOP publishing. 2020.
- Alkufi AA, Kadhim SA, Alhous SF. Comparison of excess lifetime cancer risk for different age groups for selected flour samples. In AIP conference proceedings. AIP Publishing LLC. 2022.
- El-Taher A, Al-Zahrani JH. Radioactivity measurements and radiation dose assessments in soil of Al-Qassim region, Saudi Arabia. NISCAIR-CSIR, India. 2014.
- Burrough PA. Opportunities and limitations of GIS based modeling of solute transport at the regional scale. Applications of GIS to the modeling of non-point source pollutants in the Vadose zone 1996; 48:19-38


