Research Article - Onkologia i Radioterapia ( 2024) Volume 18, Issue 10
Comparative study between hypo-fractionated simultaneous integrated boost-intensity modulated radiotherapy combined with Temozolomide versus 3D conformal radiotherapy combined with Temozolomide in treatment of Glioblastoma Multiforme
Manar M Elzayat*, Hanan Shawky Mahmoud, Lamiss Mohamed Abd Aziz and Radwa A AwadManar M Elzayat, Department of Clinical Oncology and Nuclear Medicine, Tanta University, Tanta, Egypt,
Received: 09-Sep-2024, Manuscript No. OAR-24-147642; , Pre QC No. OAR-24-147642 (PQ); Editor assigned: 11-Sep-2024, Pre QC No. OAR-24-147642 (PQ); Reviewed: 25-Sep-2024, QC No. OAR-24-147642; Revised: 24-Oct-2024, Manuscript No. OAR-24-147642 (R); Published: 31-Oct-2024
Abstract
Background: Glioblastoma Multiform (GBM) is the most common primary brain tumor in adults representing the most common diffuse glioma. The aim of this work is to evaluate patients' characteristics of both treatment groups Simultaneous Integrated Boost-Intensity Modulated Radiotherapy (SIB-IMRT) with Temozolomide (TMZ) vs. standard Three-Dimensional Conformal Radiation Therapy (3DCRT) with TMZ, compare the therapeutic index of treatment and Dosimetric differences of 3DCRT plans to that of SIB-IMRT in GBM patients.
Methods: This prospective hospital-based study was carried out on 40 patients at clinical oncology department, Tanta University Hospitals, Egypt. Patients aged ≥ 18 years old, both sexes, newly with diagnosed GBM, performance status 0-2, adequate hematological, liver and renal functions. Patients were divided into two equal groups: Group A: treated with doses of 2.4 GY, 2.2 GY, and 2.0 GY daily in 27 fractions with conformal a total dose of 64.8 GY, 59.4 GY, 54GY, using SIB-IMRT and group B: treated with 3D Radiation Therapy (3DCRT) with doses of 60 GY in 30 fractions, 2 GY per fraction, daily five days a week.
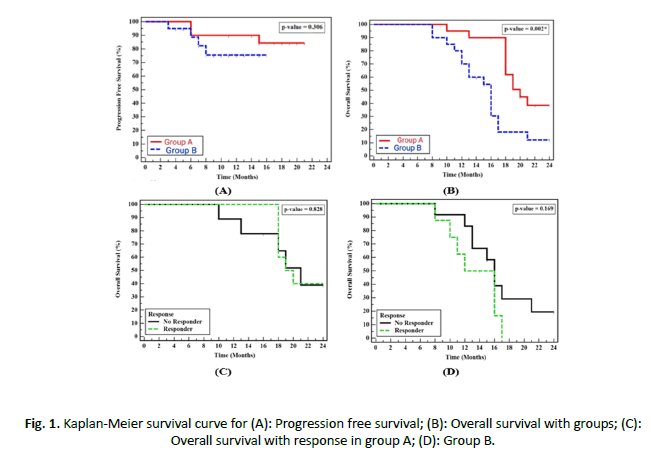
Results: Demographic data were insignificantly different between both groups while there was statistically significant difference dosimetrically between the two groups (p<0.05) including brain stem, optic nerve, optic chiasm, cochlea, lens and eyes. In group A mean PTV 95% dose was 63.5 GY ± 0.648 GY that covered by 98% of total dose ± 1% while in group B mean PTV 95% dose was 57.6 GY ± 1.2 GY (that covered by 96% of total dose ± 2%) which were statically significant (P<0.05). Regarding survival, median PFS was higher in group A than group B, but it was insignificant (p=0.306), 1-year PFS for group A was 90.0% while it was 75.5% for group B. Median OS was 20 months and 16 months for IMRT-SIB arm and 3D RT arm respectively, OS at 1 and 2-year were 95.0%, 38.6% for group A respectively and 70.0%, 12.1% respectively for group B with statistically significant difference (P=0.002). Toxicities (Non hematological and hematological) were nearly same in the two groups.
Conclusions: Hypo fractionated SIB-IMRT combined with temozolomide appears to be safe as well as effective line of treatment in patients with GBM. It implements dose escalation with hypo-fractionation protocols (SIB-IMRT), with improving survival without increasing side effects or treatment interruptions.
Keywords
Hypo-fractionated simultaneous integrated boost-intensity modulated radiotherapy; Temozolomide; 3D conformal radiotherapy; Glioblastoma multiforme
Introduction
Glioblastoma Multiform (GBM) is considered the most common primary tumor affecting brain in adult patients [1]. In the United States, Incidence rate of GBM is 3.19/100000 [2].
The incidence of GBM increases with increasing age with a peak incidence between 75-84 years old, also, higher incidence is observed among white males. GBM is not common in children, representing only 3% of all primary central nervous system tumors with 12% in survival rate in 5 years in children and less than 5% in adults [3,4].
Tumor cell infiltration is a characteristic biologic feature of GBM resulting in difficulties in complete surgical excision and accordingly more frequent recurrence [5,6].
Primary or de novo GBM is the most frequent type, characterized by a shorter clinical history (about 3 months) while the secondary type is rarer that occurred on top of lower grade gliomas [7].
Hypofractionated radiotherapy is a type of radiation therapy that aims to improve the biologic effect of radiotherapy through achieving more cell kills with higher dose/fraction with a shorter overall duration of treatment [8].
Intensity Modulated Radiotherapy (IMRT) has the advantage of more dose reduction to risk organs, while increasing dose coverage to different target volumes, SIB-IMRT technique, has the advantage of using different doses to target organs in the same fraction (dose painting). In high grade gliomas even with bad prognostic factors, several studies had reported superiority of hypo fractionated radiotherapy in terms of efficacy and toxicity [9].
This study aimed to evaluate patients' characteristics of both treatment groups SIB-IMRT with Temozolomide (TMZ) vs. standard Three- Dimensional Conformal Radiation Therapy (3DCRT) with TMZ, compare the therapeutic index of treatment and dosimetric differences of 3DCRT plans to that of SIB-IMRT in GBM patients.
Materials and Methods
Patients and methods
This prospective hospital-based study was carried out on 40 patients at clinical oncology department, Tanta University Hospitals, Egypt. Patients aged ≥ 18 years old, both sexes, newly diagnosed with GBM either histopathologically proven to have GBM or by Magnetic Resonance Spectroscopy (MRS), performance status 0-2 according to eastern cooperative oncology group [10], adequate hematological, liver and renal functions and no limitations were placed on location of tumor or extent of surgery. The study was done from April 2022 to April 2023 with follow up till July 2024 after approval of the committee of ethics at Tanta University Hospitals, Tanta, Egypt (approval code: 35442/4/2022). An informed written consent was obtained from all patients.
Exclusion criteria included patients with ECOG PS>2, previous radiation treatment to brain and pregnant or lactating women.
Patients were divided into two equal groups: Group A: treated with doses of 2.4 GY /fraction, 2.2 GY/fraction, and 2.0 GY/ fraction daily delivered to PGTV, PCTV1 and PCTV2 with a total dose of 64.8 GY, 59.4 GY and 54 GY, respectively, in 27 fractions compared with control group B: treated with 3D RT with doses 60 GY in 30 fractions, 2 GY/fraction, five days/week.
All patients underwent complete history taking, clinical examination, histopathological confirmation of GBM, laboratory investigations CBC, kidney, liver function tests and serum electrolytes (Mg, Ph, K)) as well as radiological investigations (Magnetic Resonance Imaging (MRI) brain or MRS é contrast.
Twenty patients received hypo fractionated SIB-IMRT with concomitant temozolamide (temozolomide 75mg/m2/day followed by adjuvant temozolomide) for 5 days/28 days for additional 6 cycles and 20 patients were included as a control group received 3DCRT with concurrent TMZ and adjuvant TMZ according to RTOG 0525.
Concurrent chemotherapy details
All patients administered TMZ oral dose of 75 mg/m2 daily concurrently with radiotherapy. Dose reductions weren’t recommended, but discontinuation or delay of TMZ administration were decided weekly upon toxicity. Administration of TMZ continued when all the following investigations are fullfilled: Absolute neutrophil count ≥ 1500/mm3. Platelets count ≥ 100000 /mm3. Common Toxicity Criteria (CTC) non-hematological toxicity ≤ grade 2 (except for vomiting, nausea and alopecia). During treatment a CBC obtained weekly. TMZ administration temporarily interrupted or permanently discontinued during the concomitant phase according to the hematological and nonhematological toxicity criteria.
Adjuvant phase started 4 weeks after completing the concurrent phase, patients administrated TMZ 150-200 mg/m2 once daily for 5 days for up to 6 cycles, cycle/28 days.
External beam radiotherapy
Radiation therapy started soon after surgery within 6 weeks in most patients. Every patient was placed in supine position with a customized immobilization device. All cases underwent a spiral Computed Tomography (CT) scan with 3 mm slice fusion with MRI was done if available.
For group A, the GTV defined as all contrast-enhancing lesions on the postoperative MRI T1-weighted images and the postoperative cavity with the latter fused with CT images for treatment planning. The CTV high risk was defined as GTV+ a margin of 1-2 cm, including surrounding edema on T2-weighted fluid-attenuated inversion recovery MRI. CTV low risk included CTV high risk+a margin of 1-2 cm. PTV, including PGTV, PCTV high risk (PCTV1), and PCTV low risk (PCTV2), were defined as the respective above target volume+a margin of 0.3 cm. Modification of margins to smaller ones was allowed if near risk organs (OARs), as the brain stem, optical pathway, or spinal cord, or in case of presence of anatomical barriers, as the falx cerebri, tentorium, and dura.
For group B, patients received RT according to RTOG 0525. Phase I, 46Gy in 23fr 2Gy per fraction. Growth Target Volume (GTV1) was defined as surgical resection cavity plus enhancing tumor (post contrast T1 MRI scan) plus surrounding edema (hyper intensity on T2 or FLAIR on MRI scan). CTV1 was defined as GTV 1 + margin 2 cm. This was reduced 0.5 cm in certain circumstances to allow sparing organ at risk. PTV1 was defined as CTV1 plus 3-5 mm margin. if no surrounding edema is present, then PTV2 was defined as GTV2 (T1 contrast enhanced abnormality with surgical cavity included) plus 2.5 cm.
Phase II was 14Gy boost in 7fr 2Gy per fraction. GTV2 is defined as surgical resection cavity+any residual enhancing lesion (post contrast T1 weighted MRI scans). CTV2=GTV2+2 cm. PTV2=CTV+3-5 mm.
Side effects of radiotherapy were evaluated according RTOG [11]. Acute toxicity of chemotherapy was evaluated according to Common Terminology Criteria for Adverse Events v5 (CTCAE) [12].
Response and follow up
Evaluation of the response was done by clinical assessment and MRI brain with contrast one month after the end of radiotherapy, one month after end of chemotherapy and then every 3 months or if clinically indicated. Response assessment in neuro-oncology criteria was used to assess response [13]. In case of clinical deterioration before first planned response assessment, MRI brain was done.
Statistical analysis
Statistical analysis was done using SPSS v26. Quantitative parametric variables were presented as mean and Standard Deviation (SD) and compared between the two groups utilizing unpaired student's t-test. Quantitative non-parametric data were presented as median and Interquartile Range (IQR) and were analyzed by Mann Whitney-test. Qualitative variables were presented as frequency and percentage (%) and were analyzed utilizing the Chi-square test or Fisher's exact test when appropriate. A two tailed univariate regression was used to estimate the relationship between a dependent variable and one independent variable P value ≤ 0.05 was considered statistically significant.
Results
Demographic data were insignificantly different between both groups while dosimetric parameters were significantly different between both groups (p<0.05) (Table 1).
In group A mean PTV 95% dose was 63.5 GY ± 0.648 GY (that was covered by 98% of total dose ± 1%) while in group B mean PTV 95% dose was 57.6 GY ± 1.2 GY (that was covered by 96% of total dose ± 2%) which was statically significant (P<0.05). Haematological and non-haematological toxicity were insignificantly different between both groups (Table 4).
Regarding homogeneity and conformity index. Median HI for group A 0.06 and 0.1 for group B (P value=0.002), however the median CI for both group A, B is 1.17 and 1,47 respectively and this give superiority to SIB-IMRT for target coverage and healthy tissue avoidance. Group A had higher overall response rate (55% in group A vs. 40% in group B) but it was insignificant between both groups. Comparison between both groups according to gap in treatment either CCRT or adjuvant temodal, two patients (10%) in group A didn’t receive concurrent temodal regularly due to thrombocytopenia, and 2 patients (10%) delayed starting adjuvant temodal for economic reasons. And regarding to group B 2 patients had a gap during the concurrent phase due to neutropenia and thrombocytopenia G3, and 4 patients (20%) interrupted adjuvant temodal due to variant causes (two cases due to thrombocytopenia and one due to fatigue and one due to vomiting) (Table 2).
As regard PFS, univariate analysis showed no effect of treatment gap, age, sex or surgery. As regard OS, the only factor of significance was treatment received by group A (P=0.004) (Table 3).
Hematological and non-hematological toxicity were insignificantly different between both treatment groups (Table 4).
| Treatment (A) (n=20) | Control (B) (n=20) | Test | P | ||
|---|---|---|---|---|---|
| Age (years) | 50.30 ± 11.31 | 51.85 ± 12.96 | 0.403=t | 0.689 | |
| Sex | Male | 12 (60.0%) | 10 (50.0%) | χ2=0.404 | 0.525 |
| Female | 8 (40.0%) | 10 (50.0%) | |||
| PS | 0 | 2 (10.0%) | 0 (0.0%) | χ2=1.985 | MCP=0.504 |
| PS | 1 | 13 (65.0%) | 13 (65.0%) | ||
| PS | 2 | 5 (25.0%) | 7 (35.0%) | ||
| Comorbidity | DM | 5 (25.0%) | 3 (15.0%) | χ2=0.6252=5.938 | FEP=0.695 |
| Comorbidity | Cardiac | 2 (10.0%) | 2 (10.0%) | χ2=0.000 | FEP=1.000 |
| Comorbidity | HTN | 5 (25.0%) | 10 (50.0%) | χ2=2.667 | 0.102 |
| Surgery | Partial | 8 (40.0%) | 4 (20.0%) | -- | MCP=0.173 |
| Surgery | Subtotal | 3 (15.0%) | 9 (45.0%) | ||
| Surgery | Biopsy | 4 (20.0%) | 2 (10.0%) | ||
| Surgery | Gross total | 4 (20.0%) | 5 (25.0%%) | ||
|
|
|||||
| Brain stem (GY) | 46.02 ± 4.15 | 51.60 ± 3.83 | t=4.417* | <0.001* | |
| Optic chiasm (GY) | 42.64 ± 5.88 | 50.36 ± 4.18 | t=4.786* | <0.001* | |
| Optic nerve (GY) | RT | 20.70 (13.25-34.65) | 52.05 (38.80-53.80) | U=54.000* | <0.001* |
| LT | 12.80 (10.60-26.75) | 47.35 (42.05-52.80) | U=17.000* | <0.001* | |
| Cochlea (GY) | RT | 23.20 (10.50-31.50) | 33.75 (21.80-43.55) | U=93.500* | 0.003* |
| LT | 16.65 (11.0-20.40) | 36.55 (21.10-42.45) | U=85.000* | 0.001* | |
| Lens (GY) | RT | 5.29 ± 2.61 | 6.75 ± 2.14 | U=137.50 | 0.091 |
| LT | 4.83 ± 2.10 | 6.73 ± 3.05 | U=127.00* | 0.049* | |
| Eye (GY) | RT | 10.45 (4.50-15.80) | 26.65 (16.90-42.35) | U=36.500* | <0.001* |
| LT | 14.80 (10.90-30.65) | 34.40 (19.35-42.65) | U=83.500* | 0.001* | |
Note: *Significant P<0.05; OARs: Organ at Risk; DM: Diabetes Mellitus; RT: Right; LT: Left; HTN: Hypertension
Tab. 1. Comparison between the two studied groups according to demographic data and Dosimetric (OARs parameters)
| Group A (n=20) | Group B (n=20) | U | P | |
|---|---|---|---|---|
| HI | 0.06 (0.03-0.09) | 0.10 (0.09-0.22) | 87.500* | 0.002* |
| CI | 1.27 ± 0.37 | 1.49 ± 0.60 | 130 | 0.06 |
|
|
||||
| CR | 2 (10.0%) | 0 (0.0%) | -- | -- |
| PR | 9 (45.0%) | 8 (40.0%) | -- | -- |
| SD | 6 (30.0%) | 8 (40.0%) | -- | -- |
| PD | 3 (15.0%) | 4 (20.0%) | -- | -- |
| OAR (CR+PR) | 11 (55.0%) | 8 (40.0%) | -- | -- |
| DCR (CR+PR+SD) | 17 (85.0%) | 16 (80.0%) | -- | -- |
|
|
||||
| CCRT GAP | 2 (10.0%) | 2 (10.0%) | 0 | 1 |
| Average | (Mean=3 day) | (Mean=4 day) | ||
| Adjuvant chemotherapy | 2 (10.0%) | 4 (20.0%) | 0.784 | 0.661 |
| Average | (Mean=5.5 day) | (Mean=13.5 day) | ||
Note: *Significant p<0.05; CR: Complete Response; PR: Partial Response; OARs: Organ At Risk; DCR: Disease Control Rate; PD: Progressive Disease; CCRT: Concurrent Chemoradiotherapy; HI: Homogeneity Index; CI: Conformity Index
Tab. 2. Comparison between the two studied groups according to HI, CI, response and interruption of treatment
| Univariate | |||
|---|---|---|---|
| P | HR (LL-UL 95% C. I) | ||
|
|
|||
| Treatment groups | Group A | 0.323 | 0.454 (0.095-2.176) |
| Group B | -- | 1.000 | |
| Age (years) | <50 | -- | 1.000 |
| ≥ 50 | 0.323 | 0.454 (0.095-2.176) | |
| Sex | Male | -- | 1.000 |
| Female | 0.124 | 0.189 (0.023-1.578) | |
| Surgery | No gross total | -- | 1.000 |
| Gross total | 0.528 | 0.0505 (0.061-4.201) | |
| Performance status | 0 | -- | 1.000 |
| 1 | 0.432 | 0.413 (0.046-3.739) | |
| 2 | 0.500 | 0.436 (0.039-4.864) | |
|
|
|||
| Treatment groups | Group A | 0.004* | 0.308 (0.139-0.685) |
| Group B | -- | 1.000 | |
| Age (years) | <50 | -- | 1.000 |
| ≥ 50 | 0.831 | 1.091 (0.489-2.434) | |
| Sex | Male | -- | 1.000 |
| Female | 0.965 | 0.983 (0.460-2.102) | |
| Surgery | No gross total | -- | 1.000 |
| Gross total | 0.132 | 0.438 (0.150-1.281) | |
| Performance status | 0 | -- | 1.000 |
| 1 | 0.380 | 2.466 (0.329-18.500) | |
| 2 | 0.512 | 2.019 (0.247-16.508) | |
Note: *Significant p<0.05; HR: Hazard Ratio; UL: Upper Limit; CI: Confidence Interval; LL: Lower Limit; PFS: Progression Free Survival; OS: Overall Survival
Tab. 3. Univariate COX regression analysis for the parameters affecting PFS and OS in total sample
| Group A (n=20) | Group B (n=20) | χ2 | MCP | ||
|---|---|---|---|---|---|
|
|
|||||
| Anemia | G1 | 4 (20.0%) | 4 (20.0%) | 2.065 | 0.842 |
| G2 | 0 (0.0%) | 1 (5.0%) | |||
| G3 | 0 (0.0%) | 1 (5.0%) | |||
| G4 | 0 (0.0%) | 0 (0.0%) | |||
| Neutropenia | G1 | 1 (5.0%) | 4 (20.0%) | 5.360 | 0.071 |
| G2 | 0 (0.0%) | 0 (0.0%) | |||
| G3 | 0 (0.0%) | 3 (15.0%) | |||
| G4 | 0 (0.0%) | 0 (0.0%) | |||
| Thrombocytopenia | G1 | 3 (15.0%) | 2 (10.0%) | 2.890 | 0.565 |
| G2 | 1 (5.0%) | 0 (0.0%) | |||
| G3 | 1 (5.0%) | 4 (20.0%) | |||
| G4 | 0 (0.0%) | 0 (0.0%) | |||
|
|
|||||
| Cerebral edema | G1 | 0 (0.0%) | 0 (0.0%) | 1.111 | FEP=0.605 |
| G2 | 0 (0.0%) | 0 (0.0%) | |||
| G3 | 1 (5.0%) | 3 (15.0%) | |||
| G4 | 0 (0.0%) | 0 (0.0%) | |||
| Altered consciousness | G1 | 1 (5.0%) | 0 (0.0%) | 3.607 | 0.359 |
| G2 | 0 (0.0%) | 2 (10.0%) | |||
| G3 | 0 (0.0%) | 1 (5.0%) | |||
| G4 | 0 (0.0%) | 0 (0.0%) | |||
| Concentration disorders | G1 | 2 (10.0%) | 1 (5.0%) | 3.137 | 0.409 |
| G2 | 0 (0.0%) | 3 (15.0%) | |||
| G3 | 0 (0.0%) | 0 (0.0%) | |||
| G4 | 0 (0.0%) | 0 (0.0%) | |||
| Skin desquamation | G1 | 5 (25.0%) | 4 (20.0%) | 4.371 | 0.268 |
| G2 | 2 (10.0%) | 2 (10.0%) | |||
| G3 | 0 (0.0%) | 4 (20.0%) | |||
| G4 | 0 (0.0%) | 0 (0.0%) | |||
| Pigmentation | G1 | 7 (35.0%) | 10 (50.0%) | 1.659 | 0.550 |
| G2 | 2 (10.0%) | 3 (15.0%) | |||
| G3 | 0 (0.0%) | 0 (0.0%) | |||
| G4 | 0 (0.0%) | 0 (0.0%) | |||
| Alopecia | G1 | 10 (50.0%) | 11 (55.0%) | 0.735 | 0.802 |
| G2 | 1 (5.0%) | 2 (10.0%) | |||
| G3 | 0 (0.0%) | 0 (0.0%) | |||
| G4 | 0 (0.0%) | 0 (0.0%) | |||
| Others fatigue | G1 | 4 (20.0%) | 3 (15.0%) | 3.196 | 0.406 |
| G2 | 1 (5.0%) | 5 (25.0%) | |||
| G3 | 2 (10.0%) | 2 (10.0%) | |||
| G4 | 0 (0.0%) | 0 (0.0%) | |||
| Headache | G1 | 2 (10.0%) | 4 (20.0%) | 1.944 | 0.714 |
| G2 | 3 (15.0%) | 4 (20.0%) | |||
| G3 | 1 (5.0%) | 0 (0.0%) | |||
| G4 | 0 (0.0%) | 0 (0.0%) | |||
| Nausea | G1 | 1 (5.0%) | 0 (0.0%) | 1.899 | 0.603 |
| G2 | 1 (5.0%) | 3 (15.0%) | |||
| G3 | 0 (0.0%) | 0 (0.0%) | |||
| G4 | 0 (0.0%) | 0 (0.0%) | |||
| Vomiting | G1 | 4 (20.0%) | 2 (10.0%) | 2.744 | 0.445 |
| G2 | 1 (5.0%) | 4 (20.0%) | |||
| G3 | 2 (10.0%) | 3 (15.0%) | |||
| G4 | 0 (0.0%) | 0 (0.0%) | |||
Note: Data are presented as frequency (%); χ2: Chi-square test; MC: Monte Carlo; FE: Fisher Exact
Tab. 4. Comparison between the two studied groups according to toxicity
According to treatment group, median PFS was higher in group A than group B, but it was insignificant (p=0.306), 1 year PFS for group A was 90.0% and 75.5% for group B. Median OS was 20 months and 16 months for IMRT-SIB arm and 3DCRT arm respectively, OS at 1 and 2-year were 95.0%, 38.6% for group A respectively and 70.0%,12.1% respectively for group B that was statistically significant (P=0.002). No significance in OS between responsive and non-responsive patients in both group A and group B (Figure 1).
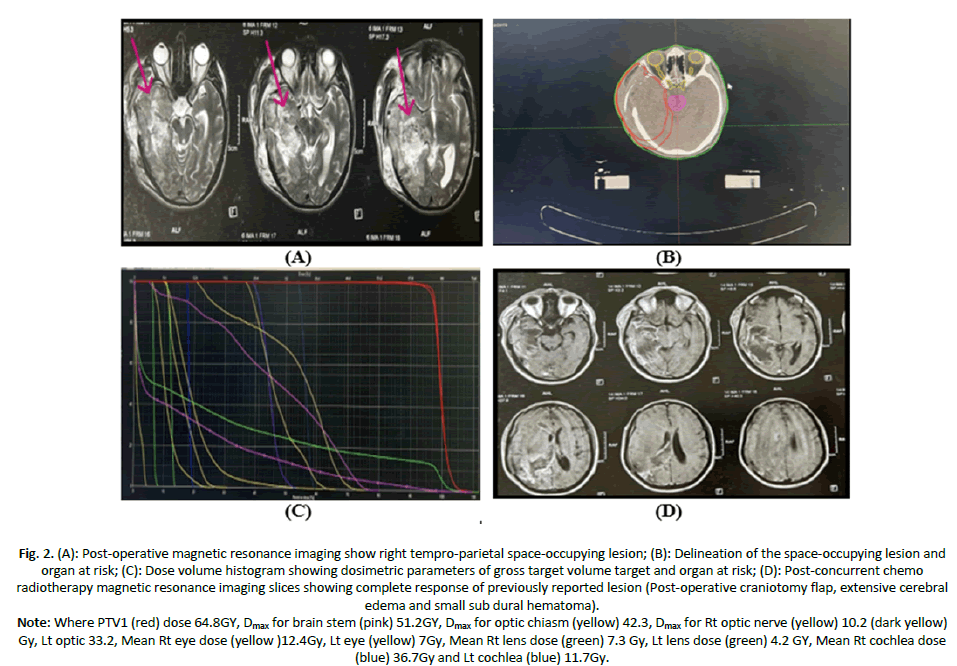
Case 1: Male patient aged 36 years old, ECOG PS 1, with Right temporal intra axial SOL measuring 8 × 6 cm, treated with excision biopsy followed by SIB-IMRT plan to 64 GY, achieved complete response after CCRT and adjuvant temodal no more than grade II toxicity (Figure 2).
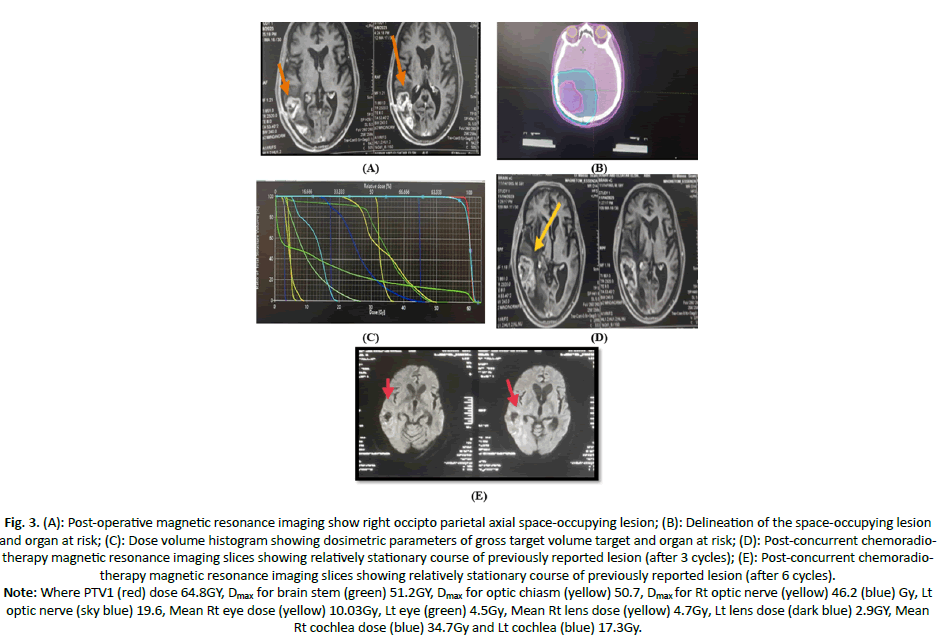
Case 2: Male patient aged 60 years old, ECOG PS 1, no comorbidity, with right occipto-parietal SOL (5.4 × 3 cm), treated with partial excision of the lesion followed by SIB-IMRT with total dose of 64 GY, with radiological SD after CCRT and adjuvant temodal with no more than grade I toxicity (Figure 3).
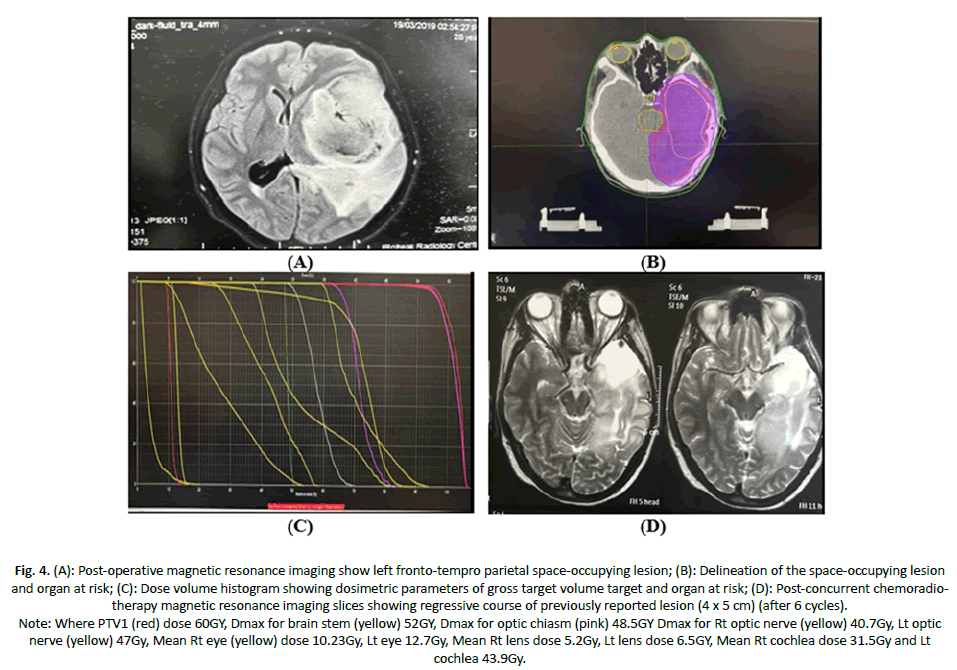
Case 3: Female patient aged 35y, PS 0 negative medical history, with Lt fronto-tempro parietal SOL 7 × 6 × 10 cm, patient underwent excision biopsy followed by 3DCRT with total dose 60Gy concurrent é TMZ achieved partial response (Figure 4).
Figure 1. Kaplan-Meier survival curve for (A): Progression free survival; (B): Overall survival with groups; (C): Overall survival with response in group A; (D): Group B.
Figure 2. (A): Post-operative magnetic resonance imaging show right tempro-parietal space-occupying lesion; (B): Delineation of the space-occupying lesion and organ at risk; (C): Dose volume histogram showing dosimetric parameters of gross target volume target and organ at risk; (D): Post-concurrent chemo radiotherapy magnetic resonance imaging slices showing complete response of previously reported lesion (Post-operative craniotomy flap, extensive cerebral edema and small sub dural hematoma).
Note: Where PTV1 (red) dose 64.8GY, Dmax for brain stem (pink) 51.2GY, Dmax for optic chiasm (yellow) 42.3, Dmax for Rt optic nerve (yellow) 10.2 (dark yellow) Gy, Lt optic 33.2, Mean Rt eye dose (yellow )12.4Gy, Lt eye (yellow) 7Gy, Mean Rt lens dose (green) 7.3 Gy, Lt lens dose (green) 4.2 GY, Mean Rt cochlea dose (blue) 36.7Gy and Lt cochlea (blue) 11.7Gy.
Figure 3. (A): Post-operative magnetic resonance imaging show right occipto parietal axial space-occupying lesion; (B): Delineation of the space-occupying lesion and organ at risk; (C): Dose volume histogram showing dosimetric parameters of gross target volume target and organ at risk; (D): Post-concurrent chemoradiotherapy magnetic resonance imaging slices showing relatively stationary course of previously reported lesion (after 3 cycles); (E): Post-concurrent chemoradiotherapy magnetic resonance imaging slices showing relatively stationary course of previously reported lesion (after 6 cycles).
Note: Where PTV1 (red) dose 64.8GY, Dmax for brain stem (green) 51.2GY, Dmax for optic chiasm (yellow) 50.7, Dmax for Rt optic nerve (yellow) 46.2 (blue) Gy, Lt optic nerve (sky blue) 19.6, Mean Rt eye dose (yellow) 10.03Gy, Lt eye (green) 4.5Gy, Mean Rt lens dose (yellow) 4.7Gy, Lt lens dose (dark blue) 2.9GY, Mean Rt cochlea dose (blue) 34.7Gy and Lt cochlea (blue) 17.3Gy.
Figure 4. (A): Post-operative magnetic resonance imaging show left fronto-tempro parietal space-occupying lesion; (B): Delineation of the space-occupying lesion and organ at risk; (C): Dose volume histogram showing dosimetric parameters of gross target volume target and organ at risk; (D): Post-concurrent chemoradiotherapy magnetic resonance imaging slices showing regressive course of previously reported lesion (4 x 5 cm) (after 6 cycles).
Note: Where PTV1 (red) dose 60GY, Dmax for brain stem (yellow) 52GY, Dmax for optic chiasm (pink) 48.5GY Dmax for Rt optic nerve (yellow) 40.7Gy, Lt optic nerve (yellow) 47Gy, Mean Rt eye (yellow) dose 10.23Gy, Lt eye 12.7Gy, Mean Rt lens dose 5.2Gy, Lt lens dose 6.5GY, Mean Rt cochlea dose 31.5Gy and Lt cochlea 43.9Gy.
Discussion
GBM is a glioma WHO grade IV, it is the most common primary malignant brain tumor with a 5-year survival of 7.2%. It has genetic heterogeneity associated with highly infiltrative nature causing great treatment challenges [14]. Despite new technologies in multimodal treatments, prognosis of cases with GBM is still poor [15-17].
In the present study, no significant differences in patients’ characteristics were found between both groups of IMRT-SIB and 3D-CRT as regard sex, age, performance status, comorbidities or surgery. Most patients in both arms were males, median age was 52, 55 years in group A and B respectively. Most patients were of ECOG performance score 1 in both groups compared to Chen et al. [18] in which 54 cases with de novo GBM from July 2009 to December 2010 underwent postoperative 3D-CRT or IMRT with concomitant and adjuvant temolozamide median age was 47 in both groups. Most patients were males, PS Karnofsky >70%.
As regard CI, it was better for IMRT-SIB than 3DRT but it was insignificant. While the median HI was better for SIB-IMRT with statistically significant difference (P=0.002). Similarly, Thibouw et al. [19] reported that the median CI was 1.53 for 3D-CRT and 1.25 for IMRT. The median HI was 0.10 for 3D-CRT and 0.07 for IMRT. Also, in Hermanto et al. [20] statistical analysis was done showing that in all the 20 cases, IMRT maintained equivalent target coverage, improved target conformity (CI 95% 1.52 vs. 1.38).
In our study SIB-IMRT showed superiority for reducing the dose to the OAR as following: Regarding group A (SIB-IMRT arm) the median Dmax of the brainstem was 46.35Gy, while in group B the median Dmax of brain stem was 52.75Gy. The median Dmax for optic chiasma was 40.90Gy in arm A compared to 52 Gy in arm B. The median Dmax received by the right and left optic nerves were 20.7Gy and 12.8Gy, respectively in group A. All showed statistically significant difference between the two groups. Similarly, Thibouw et al. [19] proved that IMRT was much better than 3D-CRT regarding conformity as well as sparing of the healthy brain (apart from the cerebellum) with a 9.1% decrease in Dmean (25 vs. 27.5Gy, p=0.02). Smaller volumes of normal brain tissue were Irradiated for V60, V50 and V45. However, it could be surprising that other risk organs received a significantly higher doses with IMRT than with 3D-CRT. Similar to our study, MacDonald et al. found that IMRT delivered lower doses to the brain tissue and brainstem (p<0.033) compared with 3DCRT [21].
In our study, according to response, group A had higher overall response rate than in group B, 55% vs. 40% respectively but it was insignificant and Disease Control Rate (DCR) was 85% in group A and 80% in group B. As regard OS, this study reported that median OS for IMRT-SIB group was 20 months vs. 16 months for 3DCRT arm, 1 year, 2-year OS were 95.0%, 38.6% for group A respectively and 70.0%, 12.1% respectively for arm B that were statistically significant. Zhong et al. had followed up 75 cases with GBM who treated with hypofractionated SIB-IMRT concurrently with temolozamide, they reported that 5 cases didn’t receive concurrent TMZ for personal issues, 64 cases received adjuvant TMZ, while 11 cases didn’t receive adjuvant TMZ for economic issues. The median number of adjuvant TMZ cycles was 5. After a median follow-up of 16 months, 45 (56.3%) cases had died, and 49 (64.8%) cases had tumor progression. The median PFS and OS rates were 15 months and 21 months, respectively [5].
In agreement with us Chen et al. [18] proved that IMRT showed a better survival rate by using the hypo fractionated regimen.
As regard PFS, univariate analysis showed that there were no significant effect, regarding sex, age, PS, treatment group or surgery. And regarding OS, univariate analysis showed that the only factor of significance was treatment regimen for group A. In comparable to Brown et al. [22] who examined the impact of tumor biomarkers, sex, age on survival of 490 cases with GBM. They found that median survival in cases who underwent debulking surgery at diagnosis was 14.9 months vs. 8.0 months in those who diagnosed by biopsy only. Zhong et al. [5] concluded that extent of surgery, age, total number of TMZ cycles and KPS scores were significant factors affecting OS and PFS in univariate analysis. These differences may be explained by small sample size of our study.
Regarding hematological and non-hematological toxicities, both arms of our study were nearly similar, no difference between 2 treatment groups but G3 and G4 toxicities were mainly seen in control group (B). Similarly, Zhong et al. found that the most common non hematological acute toxicities were headache, fatigue, nausea, and hematologic toxicities, which were mainly grade 1 or 2 that occurred during the concurrent treatment with temozolomide. Also, they reported that they had 2 patients (2.5%) presented with progressive headache and dizziness 1 year after RT, and MRI showed increased enhancement (Supplementary Tables and Figures) [5].
Limitations of our study included the relatively small sample size that conducted at a single center with a short follow up period.
Conclusion
Hypofractionated radiation therapy using SIB-IMRT concurrently with temozolomide has shown to be safe and effective modality in patients with GBM. IMRT showed a statistically significant difference in terms of target coverage with respecting dose constraints of organ at risk as in RTOG recommendations. This technique can be used to implement dose escalation with hypo- fractionation protocols (SIB-IMRT), aiming to improve survival without increasing treatment interruptions or side effects.
Financial Support and Sponsorship
Nil.
Conflict of Interest
Nil.
References
- Schaff LR, Mellinghoff IK. Glioblastoma and other primary brain malignancies in adults: A review. JAMA. 2023; 329:574-587.
[Crossref] [Google Scholar] [PubMed]
- Low JT, Ostrom QT, Cioffi G, Neff C, Waite KA, et al. Primary brain and other central nervous system tumors in the United States (2014-2018): A summary of the CBTRUS statistical report for clinicians. Neurooncol Pract. 2022; 9:165-182.
[Crossref] [Google Scholar] [PubMed]
- Fernandes C, Costa A, Osório L, Lago RC, Linhares P, et al. Current standards of care in glioblastoma therapy. Exon Publications. 2017: 197-241.
[Crossref] [Google Scholar] [PubMed]
- Liao G, Zhao Z, Yang H, Li X. Efficacy and safety of hypofractionated radiotherapy for the treatment of newly diagnosed glioblastoma multiforme: A systematic review and meta-analysis. Front Oncol. 2019; 9:1017.
[Crossref] [Google Scholar] [PubMed]
- Zhong L, Chen L, Lv S, Li Q, Chen G, et al. Efficacy of moderately hypofractionated simultaneous integrated boost intensity-modulated radiotherapy combined with temozolomide for the postoperative treatment of glioblastoma multiforme: A single-institution experience. Radiat Oncol. 2019; 14:104.
[Crossref] [Google Scholar] [PubMed]
- Glas M, Ballo MT, Bomzon ZE, Urman N, Levi S, et al. The impact of tumor treating fields on glioblastoma progression patterns. Int J Radiat Oncol Biol Phys. 2022; 112:1269-1278.
[Crossref] [Google Scholar] [PubMed]
- Mann J, Ramakrishna R, Magge R, Wernicke AG. Advances in radiotherapy for glioblastoma. Front Neurol. 2018; 8:748.
[Crossref] [Google Scholar] [PubMed]
- Shuryak I, Hall EJ, Brenner DJ. Optimized hypofractionation can markedly improve tumor control and decrease late effects for head and neck cancer. Int J Radiat Oncol Biol Phys. 2019; 104:272-278.
[Crossref] [Google Scholar] [PubMed]
- Cho B. Intensity-modulated radiation therapy: A review with a physics perspective. Radiat Oncol J. 2018; 36:1-10.
[Crossref] [Google Scholar] [PubMed]
- Oken MM, Creech RH, Tormey DC, Horton J, Davis TE, et al. Toxicity and response criteria of the Eastern Cooperative Oncology Group. Am J Clin Oncol. 1982; 5:649-656.
[Google Scholar] [PubMed]
- Cox JD, Stetz J, Pajak TF. Toxicity criteria of the Radiation Therapy Oncology Group (RTOG) and the European Organization for Research and Treatment of Cancer (EORTC). Int J Radiat Oncol Biol Phys. 1995; 31:1341-1346.
[Crossref] [Google Scholar] [PubMed]
- Freites-Martinez A, Santana N, Arias-Santiago S, Viera A. Using the common terminology criteria for adverse events (CTCAE-version 5.0) to evaluate the severity of adverse events of anticancer therapies. Actas Dermosifiliogr. 2021; 112:90-92.
[Crossref] [Google Scholar] [PubMed]
- Chukwueke UN, Wen PY. Use of the Response Assessment in Neuro-Oncology (RANO) criteria in clinical trials and clinical practice. CNS Oncol. 2019; 8:CNS28.
[Crossref] [Google Scholar] [PubMed]
- Wu W, Klockow JL, Zhang M, Lafortune F, Chang E, et al. Glioblastoma Multiforme (GBM): An overview of current therapies and mechanisms of resistance. Pharmacol Res. 2021; 171:105780.
[Crossref] [Google Scholar] [PubMed]
- Truc G, Bernier V, Mirjolet C, Dalban C, Mazoyer F, et al. A phase I dose escalation study using simultaneous integrated-boost IMRT with temozolomide in patients with unifocal glioblastoma. Cancer/Radiother. 2016; 20:193-198.
[Crossref] [Google Scholar] [PubMed]
- Chen C, Damek D, Gaspar LE, Waziri A, Lillehei K, et al. Phase I trial of hypofractionated intensity-modulated radiotherapy with temozolomide chemotherapy for patients with newly diagnosed glioblastoma multiforme. Int J Radiat Oncol Biol Phys. 2011; 81:1066-10674.
[Crossref] [Google Scholar] [PubMed]
- Elghareeb M, Wahba HA, Demeri AM, Elashry M, Khedr RA. Hypofractionated radiotherapy using simultaneous integrated boost technique with concurrent and adjuvant Temozolomide for Glioblastoma. J Cancer Tumor Int. 2020; 10:16-23.
- Chen YD, Jin FE, Tong FA, Ming YA, Qiu XG, et al. Effect of intensity-modulated radiotherapy versus three-dimensional conformal radiotherapy on clinical outcomes in patients with glioblastoma multiforme. Chin Med J. 2013; 126:2320-2324.
[Crossref] [Google Scholar] [PubMed]
- Thibouw D, Truc G, Bertaut A, Chevalier C, Aubignac L, et al. Clinical and dosimetric study of radiotherapy for glioblastoma: Three-dimensional conformal radiotherapy versus intensity-modulated radiotherapy. J Neurooncol. 2018; 137:429-438.
- Hermanto U, Frija EK, Lii MJ, Chang EL, Mahajan A, et al. Intensity-Modulated Radiotherapy (IMRT) and conventional three-dimensional conformal radiotherapy for high-grade gliomas: Does IMRT increase the integral dose to normal brain?. Int J Radiat Oncol Biol Phys. 2007; 67:1135-1144.
[Crossref] [Google Scholar] [PubMed]
- MacDonald SM, Ahmad S, Kachris S, Vogds BJ, DeRouen M, et al. Intensity modulated radiation therapy versus three‐dimensional conformal radiation therapy for the treatment of high grade glioma: A dosimetric comparison. J Appl Clin Med Phys. 2007; 8:47-60.
[Crossref] [Google Scholar] [PubMed]
- Brown NF, Ottaviani D, Tazare J, Gregson J, Kitchen N, et al. Survival outcomes and prognostic factors in glioblastoma. Cancers. 2022; 14:3161.
[Crossref] [Google Scholar] [PubMed]
