Research Article - Onkologia i Radioterapia ( 2023) Volume 17, Issue 6
Investigating the impact of key tumor markers to predict and reduction of lymphoma cancer diagnosis duration with a data mining approach
Mohsen Ghorbian*Mohsen Ghorbian, Department of Computer Engineering, Qom Branch, Islamic Azad University, Qom, Iran, Email: ghorbian68@gmail.com
Received: 11-Apr-2023, Manuscript No. OAR-23-92498; Accepted: 19-Jun-2023, Pre QC No. OAR-23-92498 (PQ); Editor assigned: 15-Apr-2023, Pre QC No. OAR-23-92498 (PQ); Reviewed: 30-Apr-2023, QC No. OAR-23-92498 (Q); Revised: 28-May-2023, Manuscript No. OAR-23-92498 (R); Published: 30-Jun-2023
Abstract
Various data mining techniques are available today, resulting in different results with varying precisions; therefore, selecting the appropriate methodology can result in a more complete and accurate data analysis. Hence, there are several ways to evaluate the effectiveness of data mining techniques. Choosing the appropriate data mining techniques depends on the type of data on which they will be implemented. When it comes to using data, data in every field has its significance. However, data plays a more significant aspect in specific fields, such as healthcare and data collection for caners. Using data mining techniques to analyse sensitive data like cancers can be challenging if the available information is incomplete, which can significantly impact the results. When working with the information of people with lymphoma cancer, the frequency of factors causing the disease and the lack of information are significant challenges. Lymphoma cancers can be classified as either Hodgkin's disease or non-Hodgkin's disease, which are common cancers. In this research, the criterion for selecting factors tumour markers is the presence of commonality between two types of lymphoma cancer. Five tumour markers, CD3, CD15, CD20, CD30, and LCA, along with the type of lymphoma cancer and the patient's gender, were selected as the variables of this research. Hence, to evaluate two data mining techniques, the Bayesian Networks (Naive Bayes), and the decision tree, we will apply the criteria of accuracy, sensitivity, f-score, and error ratio. However, to determine whether lymphoma cancer diagnosis factors have a positive impact, a 90% confidence interval and a 65% support value have been selected to take into account the highest level of accuracy when determining which factor is effective in diagnosing lymphoma cancer. Based on the implementation of techniques and evaluations, it was determined that the decision tree technique outperformed the Bayesian Networks (Naive Bayes) technique with an accuracy of 82.66%, a sensitivity of 94.98%, a harmonic mean of 85.36%, and an error ratio of 17.33%.Our research also concluded that the presence of CD3 and CD15 positive tumour markers, .also the gender of the individual, do not play a role in the diagnosis of lymphoma cancer. However, CD20 and LCA tumour markers can be effective in diagnosing non-Hodgkin's lymphoma, while CD30 tumour markers can be effective in diagnosing Hodgkin's lymphoma.
Keywords
data mining technique, decision tree, cancer prediction, lymphoma cancer
Introduction
In recent years, used computerized systems have resulted in a substantial amount of data being accumulated and stored in databases at a rapid pace [1]. This massive amount of data cannot be processed and analysed by humans. Many relationships and patterns between different parameters can be discovered hidden within this voluminous data, which can be essential for strategic and long-term planning [2]. Therefore, the analysis of these voluminous data is considered one of the essential needs. Extracting knowledge from such massive data requires a process known as knowledge discovery or data mining [3]. As a general rule, data mining is not restricted to a particular field and can be used wherever there is data. A recent study has shown that data mining has great significance and power in the health field [4]. In light of the connection between this field and human health, data mining will be of particular importance since prevention, cost reduction, and improving the speed of diagnosis of diseases and treatment of patients are considered essential topics in the area of healthcare [5]. By analysing patients' information and applying data mining science, it is possible to develop patterns that can help healthcare experts predict disease or even speed up the diagnosis of a disease by identifying the existing relationships between those patterns and the existing relationships between them [6]. By doing so, doctors can prevent the emergence of a disease, identify people who are susceptible to the disease, and ultimately increase the speed of diagnosis and treatment, thereby reducing costs and increasing efficiency [7]. Various techniques have been considered for analysing and exploring information using data mining. Consequently, the accuracy and correctness of the results of data analysis using these techniques will also differ [8]. For data mining to be effective in the health field, it is necessary to employ techniques that can display the accuracy and correctness of the results to the highest degree possible [9]. Consequently, selecting an effective and practical technique that will perform well is of utmost importance. By evaluating these criteria, it is possible to select the best techniques by evaluating them so that, based on the results, the best technique can be chosen [10]. Several criteria have been defined for evaluating data mining techniques. Using these criteria allows the performance of these techniques to be compared and the most appropriate and effective technique to be selected [11]. This study aims to evaluate the application of algorithms Bayesian Networks (Naive Bayes) and decision-tree in the diagnosis of lymphoma cancer to choose a technique that is more efficient and superior to the other two.
Related Work
A significant challenge related to data mining techniques is ensuring that the chosen technique performs optimally in the health sector. Considering the importance of health care, it is imperative to determine which technique will be more effective and whether the results will be more reliable. As well as evaluating techniques based on many criteria, many other challenges must be addressed, for example, the trustworthiness of data mining results. In order to select a technique with optimal efficiency based on the results of applying these criteria, it is necessary to select criteria that can accurately evaluate the performance of different techniques. Health researchers have conducted many studies to implement data mining techniques on health-related data. The results of these studies are presented in the following section. Chen et al. utilized the decision tree technique to develop a model that reduced the chances of specialists making mistakes in diagnosing breast cancer[12]. They found favourable results in their study. Joshi et al. performed a heart disease prediction using three different data mining techniques, namely decision tree, Bayesian networks, and K-nearest neighbours[13]. Anisha et al. carried out research using the nearest neighbour K technique to detect liver cancer in patients undergoing medical treatment [14]. Yasuda and Anansayrena proposed a method that using data mining techniques to improve the process of an ovarian cancer diagnosis. Kalaislova and Nasira used the K nearest neighbor method. It was possible to predict diabetes in people with heart disease and cancer[15, 16]. As a result, the relationship between different diseases was discovered. Javarja et al. Employed artificial neural networks to diagnose and classify breast cancer accurately, and the results were encouraging [17]. Ojha et al. examined breast cancer recurrence risk after chemotherapy and radiotherapy using data mining tools such as decision tree and support vector machines [18].
Implementation plan
Selecting an effective and efficient technique has always been challenging in implementing data mining projects. In the data mining of each of the presented techniques, a series of features can distinguish it from other existing techniques and demonstrate a different performance due to these features. This research utilized Bayesian Networks (Naive Bayes) and decision tree to analyse the data. The decision tree classification technique is widely used and common in data mining. It produces a predictive model that displays the inferred facts related to a target variable through a structure created by this method. It is easy to interpret decision tree because they provide simple, straightforward, and understandable models [19]. The Naive Bayesian learning technique uses classes as unique attributes that are conditionally independent, following the Bayes rule. It has a high level of competitive classification accuracy, which has made it widely used. According to this method, the time required for training depends on the number of training samples available and the number of linear features available, making it more computationally efficient [20]. Lymphoma is a type of cancer that arises from lymphatic tissues. This type of cancer occurs when an immune cell called the lymphocyte becomes malignant, dangerous, and deadly and destroys healthy cells, disrupting the body's natural cycles and causing cancer. This type of cancer is among the most difficult to diagnose initially [21]. In this research analysed 100 patients' data with lymphoma cancer between 2018 and 2022. The dataset included two types of lymphoma cancer such as Hodgkin’s and non-Hodgkin. It is important to note that Hodgkin's lymphoma is the most common form of cancer. In order to avoid an unnecessary expansion of the existing data set, all five types of Hodgkin's cancer are considered only one type of Hodgkin cancer. There are different types of information contained in this dataset. These include:
1. The gender of the sick person.
2. The type of cancer.
3. People's ages.
4. The type of tumour markers detected during the relevant tests.
The implementation plan for this research is shown in Figure 1. In the following, we will examine each step in detail.

Figure 1: Implementation plan
Primary processing
For data mining techniques to be applied to the unstructured data collected from lymphoma cancer patients, it is necessary to convert this data into structured data. In order to convert unstructured data into structured data, there must be a variety of changes made to this data. These changes included the Separation of lymphoma patients, Combining Hodgkin's lymphoma types, and Positive and negative markers converted to T and F.
Separation of lymphoma patients
This study examined the data of 100 individuals with lymphoma whose cancer diagnosis was definitive at the time of the study. In addition to the number of samples examined, it is essential to note that, during the same period, data related to individuals who had yet to be definitively diagnosed were also examined. The number of samples reached 70 despite the lack of indications of the disease's particular type. It is essential to mention that 100 definitive samples have been used in this research.
Combining Hodgkin's lymphoma types
Since Hodgkin's cancer can be divided into different types, it seems necessary to convert all types into a specific type of cancer. At this stage, all five types of Hodgkin's cancer have merged into one type known as Hodgkin's lymphoma. Alternatively, the sample table uses it as HL (Hodgkin lymphoma). However, there is only one type of non-Hodgkin's cancer in the sample table, DLBCL (Diffuse large B cell lymphoma).
Positive and negative markers are converted to P and N
The name of each tumour marker is displayed in the information table as the column's name. In the prepared table, the contents of each tumour marker's column are displayed as P and N, respectively. In other words, P and N stand for Positive and Negative, respectively. Each column indicates the results of the tests, positive or negative tumour markers.
Data preparation and feature selection
It is important to note that even though the information has been transformed into the considered structure, it still needs to be modified. In order to create an effective data mining process, the data must reach this stage before data mining techniques can utilize it. The data preparation stage is considered the most important stage in data mining since it is essential
Features selection
Due to the multitude of features in the lymphoma cancer patient information, it is not practical to consider them all, as not all are necessary for data mining. Therefore, the importance the frequency of gender diagnosed with lymphoma cancer, gender, and type of cancer can be selected as desirable characteristics; on the other hand, patients may also have a substantial impact on the type and frequency of cancers that they have been diagnosed with. In the section related to the selection of tumour markers, it is essential to note that each type of lymphoma, i.e., Hodgkin's and non-Hodgkin, has specific and shared tumour markers. The study will therefore focus on tumour markers as required features for both types of lymphoma. The characteristics considered for this research are shown in Table 1.
Tab. 1. Features selection
| Properties | Value | |
|---|---|---|
| Diagnosis | DLBCL | HL |
| LCA | N | P |
| CD20 | N | P |
| CD30 | N | P |
| CD15 | N | P |
| CD3 | N | P |
| Gender | F | M |
Placement of missing values
Missing values are a difficulty when preparing data for data mining uses. Having transformed the data into a dominant structure required to conduct data mining, typically in a table, we will encounter houses of no value within the table and in front of some of these features. In this research, we will encounter two features whose values are non-existent as we work with the selected features. Consequently, two tumour markers have missing values, including CD15 and CD30. The number of missing values for tumour markers CD30 and CD15 in the 100 examined samples is 16 in the case of tumour marker CD30 and 15 in the case of tumour marker CD15. In data mining, the main objective is to select features with a low number of missing values, meaning values that can be filled with the methods considered in data mining without affecting the main result significantly. The study will focus on features with a limited number of missing values.
Model creation
After selecting features and preparing data, it is possible to use data mining techniques to identify the required patterns. With the help of data mining techniques, it is possible to identify patterns in data. Still, more is needed, as data mining techniques various can be used to increase the accuracy and confidence of the results. Consequently, data mining techniques must provide accurate and valid results based on the available data. Data mining techniques must be able to perform the learning process using accurate and valid data to provide accurate and valid predictions based on what they have learned. A data mining technique utilizes two data set types: training and testing data. When data mining techniques use training data sets to learn about data, they will then analyse test data sets in light of what they have learned from the training data sets. In other words, it will be based on the results of implementing data mining techniques based on learning the techniques obtained from the same data set.
Choosing a data mining techniques
After completing the second stage, the information about lymphoma cancer patients has been organized into appropriate data structures. Hence, after the second stage, data mining techniques will be selected and implemented on the existing data set. A wide range of data mining techniques is available for effectively exploring the data. Therefore, a structured user data set is necessary for the implementation of techniques related to classification. The classification techniques are, hence, most appropriate for exploring the existing data set based on the structure of the existing data set. Because this research aims to evaluate data classification methods to determine which is most efficient and performs the best, it is necessary to choose different techniques. Currently, this research considers two methods: Bayesian Networks (Naive Bayes) and decision tree
Model making
This step is considered the last stage in the research framework. A data mining model is created based on the available data set and selected techniques. However, based on the purpose of this study, which is to evaluate data mining techniques, the model is created based on the available data set and selected techniques. It is necessary to define evaluation criteria. Evaluation criteria are used to compare and evaluate techniques. Several evaluation factors were considered in this research, including accuracy, error ratio, F-score, and sensitivity
Accuracy evaluation criterion: In data mining processes, the accuracy evaluation criterion is a crucial and widely used criterion for evaluating a model. This evaluation criterion is obtained by determining the proportion of samples whose labels are correctly estimated by the model in relation to the total number of samples estimated by the model. , Ac The calculation method of this criterion is shown in the formula (1).
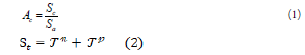
In this regard, St determines the number of samples whose labels were positive and correctly predicted and the number of samples whose labels were negative and correctly predicted.

Also, Sa include the sum of all the same predicted samples the number of samples whose labels were positive and correctly predicted. Tn The number of samples labeled as negative and correctly predicted. Fp The number of samples whose labels were positive and incorrectly predicted. Fn The number of examples whose labels were negative and incorrectly predicted.
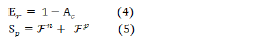
Error rate evaluation criterion: An error rate evaluation criterion plays the opposite role of an accuracy criterion. This evaluation criterion calculates by dividing the number of samples whose labels have been incorrectly estimated by the model by the number of all samples whose labels have been incorrectly estimated. Therefore, the error rate can be calculated by subtracting the accuracy criterion from the number one in that model. Er, The calculation method of this criterion is shown in formula (4) or (6) [22].

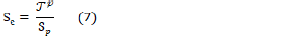
Sensitivity evaluation criterion: The Sensitivity evaluation criterion can be calculated by dividing the number of samples of true positive estimated by summing the total number of true positive samples and false negative estimated by the model to calculate the number of correct estimates in a data set. This evaluation criterion is used to determine true positive values. The calculation method of this criterion is shown in the formula (7) [23].
F-score evaluation criterion: An F-score evaluation criterion is calculated by combining precision and recall criteria. This evaluation criterion is used to have high efficiency in many situations. This criterion can be calculated by multiplying the precision and recall criteria by their sum. When this evaluation criterion calculates, the F-score will have a value directly related to the precision and recall. It is important to note that high precision and recall evaluation criteria will also result in high F-scores. The F score is calculated as a measure of the harmonic mean of a system's recall and precision values which is used to measure how efficiently the system estimates recall and precision. Fs, The calculation method of this criterion is shown in formula (8) [24].
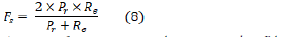
A measure of precision is essential in instances where False Positives are costly. In the precision criterion, predictions with a high level of certainty are the ones with fewer false positives than those with a high level of accuracy. In other words, in this criterion, the number of actual positive predictions is divided by the overall number of predictions that are positive. For example, in the detection of email spam, false positives occur when an email that was not spam (in fact, negative) has been predicted as spam (identified as spam). An email user may miss crucial emails if the spam detection model does not provide high precision. PrThe calculation method of this criterion is shown in formula (9).

A recall criterion is also known as a true positive rate, which indicates how many data samples collected for a particular class of interest can be predicted correctly by a machine learning model out of all data samples collected for that class. Re The calculation method of this criterion is shown in formula (10).

Concluded results
This study evaluates two data mining techniques, Bayesian Networks (Naive Bayes) and decision tree, based on data collected from lymphoma patients. This research aims to evaluate the effectiveness of two data mining techniques in determining the effect of positive tumour markers as well as gender on lymphoma cancer occurrence by type.
Results of research
This section examines the performance of two data mining techniques, Bayesian networks (Naive Bayes) and decision tree with five tumour markers, such as LCA, CD3, CD15, CD20, and CD30, to investigate the performance of each of these techniques. Also, it has been tried to identify the tumour marker factors that positively affect the occurrence of lymphoma cancer. In addition, this study examines the role of gender as a separate parameter on the occurrence of lymphoma cancer. Consequently, to determine the effectiveness of a factor with a positive effect based on the type of cancer, a series of conditions must be met in the form of criteria defined for this purpose. Hence, it is necessary for the factors considered to achieve the results at a sufficient level or, in other words, meet the determined conditions to be deemed until as influential factors with positive effects on lymphoma cancer occurrence. Since confidence and support are two criteria defined in this research, these values may vary based on the type of data set used. Due to the use of data related to health and medicine, considered sensitive data sets, it is necessary to consider the defined values for these two elements as high values. The confidence interval element for the data set of people with lymphoma cancer equals 90%. The support value element for this collection is also defined as 65% (number of 33 samples out of 50 samples). Based on the 100 samples included in this data set, 50 samples have been diagnosed with Hodgkin's lymphoma, and 50 samples have been diagnosed with non-lymphoma Hodgkin's. Throughout the research process, select the best techniques once all implementations are complete and the best techniques have emerged. All stages of the research process will include the most effective techniques as part of the process. In order to determine the best technique for collecting healthcare data, the results obtained from implementing each technique at each stage are averaged. Table 2 presents the status of each of the selected features in all 100 samples and in each type of lymphoma cancer; these data will be used to determine the superior technique and the influence of the selected features. A comparison of two data mining techniques, decision tree and Bayesian networks (Naive Bayes), can be found in Table 3. Table 3 shows the results using the determined features relating to lymphoma cancer clinical parameters patient information based on accuracy, sensitivity, f-score, and error ratio. The following sections will provide a more detailed explanation of the results obtained.
Tab. 2. Symbols used and a brief description
| Symbols | Brief description |
|---|---|
 |
Accuracy evaluation criterion |
 |
True Positive |
 |
True Negative |
 |
False Positive |
 |
False Negative |
 |
Error Rate evaluation criterion |
 |
Sensitivity evaluation criterion |
 |
F-score evaluation criterion |
 |
Recall evaluation criterion |
 |
Precision evaluation criterion |
Tab. 3. The status of selected features among 100 samples
| Bayesian Networks (Naive Bayes) | Decision tree | Non-Hodgkin's lymphoma cancer (50 samples) | Hodgkin's lymphoma cancer (50 samples) | 100 samples available | Clinical parameters | ||||||||||
|---|---|---|---|---|---|---|---|---|---|---|---|---|---|---|---|
| Error rate | F-score | Sensitivity | Accuracy | Error rate | F-score | Sensitivity | Accuracy | Positive | Negative | Positive | Negative | Positive | Negative | ||
| (%) | (%) | (%) | (%) | (%) | (%) | (%) | (%) | Count | Count | Count | Count | Count | Count | ||
| 28 | 82.45 | 84.03 | 72 | 19 | 89.47 | 100 | 81 | 11 | 39 | 8 | 42 | 19 | 81 |
CD3 |
|
| 4 | 94.35 | 96.67 | 96 | 8 | 88.6 | 90.83 | 92 | 50 | 0 | 15 | 35 | 65 | 35 |
CD20 |
|
| 30 | 69.9 | 82.5 | 70 | 27 | 75.2 | 97.5 | 73 | 31 | 19 | 9 | 41 | 40 | 60 |
CD30 |
|
| 13 | 82.26 | 89.17 | 87 | 14 | 81.83 | 89.17 | 86 | 49 | 1 | 16 | 34 | 65 | 35 |
LCA |
|
| 10 | 91.62 | 89.29 | 90 | 8 | 93.43 | 92.38 | 92 | 0 | 50 | 33 | 17 | 33 | 67 |
CD15 |
|
| 33 | 79.87 | 93.39 | 67 | 28 | 83.66 | 100 | 72 | 38 | 12 | 34 | 16 | 72 | 28 |
Gender |
|
CD3 Tumour marker
Based on findings, positive tumour markers for CD3 are not a reliable diagnostic tool for determining whether a patient has non-Hodgkin or Hodgkin's lymphoma, as shown in Figure 2.

Figure 2: Bayesian networks (Naive Bayes) versus decision tree technique for predicting CD3-positive tumour marker
The results of the investigations indicated that the decision tree technique is superior to the Bayesian Networks (Naive Bayes) technique for predicting the effect of CD3 tumour markers on lymphoma cancer diagnosis based on the criteria of accuracy, sensitivity, f-score, and error rate, as shown in Figure 3.

Figure 3: Bayesian networks (Naive Bayes) versus decision tree technique for predicting CD3-positive tumour marker based on criteria of accuracy, sensitivity, f-score, and error rate
CD20 Tumour marker
Based on the results of two decision tree techniques and Bayesian Networks (Naive Bayes), CD20-positive tumour markers cannot play an influential role in the occurrence of Hodgkin lymphomatype cancer. In addition, CD20 positivity in non-Hodgkin's lymphoma cancer may be considered an influential factor in the occurrence of non-Hodgkin's lymphoma cancer, as shown in Figure 4.

Figure 4: Bayesian networks (Naive Bayes) versus decision tree technique for predicting CD20-positive tumour marker
Based on the accuracy, sensitivity, f-score, and error rate, the Bayesian Networks (Naive Bayes) technique can be more effective than the decision tree technique in predicting the effect of CD20 tumour markers in lymphoma cancer diagnosis, as shown in Figure 5.

Figure 5: Bayesian networks (Naive Bayes) versus decision tree technique for predicting CD20-positive tumour marker based on criteria of accuracy, sensitivity, f-score, and error rate
CD30 Tumour marker
The results of two decision tree techniques and Bayesian Networks (Naive Bayes) indicate that CD30-positive tumour markers can be considered ineffective as a predictor of non-Hodgkin's lymphoma cancer development. However, CD30-positive tumour markers may effectively demonstrate the possibility of developing Hodgkin's lymphoma, as shown in Figure 6.

Figure 6: Bayesian networks (Naive Bayes) versus decision tree technique for predicting CD30-positive tumour marker
The decision tree technique outperformed the Bayesian Networks (Naive Bayes) technique in predicting the effect of CD30 tumour markers on diagnosing lymphoma cancer based on accuracy, sensitivity, f-score, and error rate, as shown in Figure 7.

Figure 7: Bayesian networks (Naive Bayes) versus decision tree technique for predicting CD30-positive tumour marker based on criteria of accuracy, sensitivity, f-score, and error rate
LCA Tumour marker
According to the results, the positive LCA tumour marker does not influence the occurrence of Hodgkin's lymphoma cancer according to the predictions made by two decision tree techniques and Bayesian Networks (Naive Bayes). On the other hand, a positive LCA tumour marker can also be associated with nonHodgkin's lymphoma cancer, as shown in Figure 8.

Figure 8: Bayesian networks (Naive Bayes) versus decision tree technique for predicting LCA-positive tumour marker.
In terms of accuracy, sensitivity, f-score, and error ratio, the decision tree technique outperformed the Bayesian Networks (Naive Bayes) technique in predicting the impact of the LCA tumour marker in lymphoma cancer diagnosis, as shown in Figure 9.

Figure 9: Bayesian networks (Naive Bayes) versus decision tree technique for predicting LCA-positive tumour marker based on criteria of accuracy, sensitivity, -score, and error rate
CD15 Tumour marker
Both decision tree techniques and Bayesian Networks (Naive Bayes) indicate that CD15-positive tumour markers are not an effective risk factor for non-Hodgkin's lymphoma and Hodgkin's lymphoma cancer diagnosis, as shown in Figure 10.

Figure 10: Bayesian networks (Naive Bayes) versus decision tree technique for predicting CD15-positive tumour marker
In terms of accuracy, sensitivity, f-score, and error rate, the decision tree technique was better than Bayesian Networks (Naive Bayes) techniques in predicting CD15 tumour marker effects on lymphoma cancer diagnosis, as shown in Figure 11.

Figure 11: Bayesian networks (Naive Bayes) versus decision tree technique for predicting CD15-positive tumour marker based on criteria of accuracy, sensitivity, f-score, and error rate.
Gender property
According to the resul of two decision tree techniques and Bayesian Networks (Naive Bayes), gender is not significantly related to diagnosing Hodgkin's and non-Hodgkin's lymphomas, as shown in Figures 12 and 13.

Figure 12: Bayesian networks (Naive Bayes) technique for predicting Gender property

Figure 13: Decision tree technique for predicting gender property
In terms of accuracy, sensitivity, harmonic mean, and error ratio, the decision tree performed better than Bayesian Networks (Naive Bayes) in predicting the effect of gender characteristics on lymphoma cancer diagnosis, as shown in Figure 14.

Figure 14: Bayesian networks (Naive Bayes) versus decision tree technique for predicting Gender property based on criteria of accuracy, sensitivity, f-score, and error rate
Comparing results of implementations
In order to calculate the final results of implementations, we summed the results obtained from implementing two decision tree techniques, Bayesian Networks (Naive Bayes) based on tumour markers and gender, as is shown in Table 3. As a result of averaging the results of the various techniques during the various processes, we can gain a greater understanding of the overall performance. The results of this averaging shown in Table 4.
Tab. 4. Final comparison of the performance of Bayesian networks (Naive Bayes) and decision trees
| Data mining technique | F-Score | Accuracy |
|---|---|---|
| Decision tree | 85.36 | 82.66 |
| Bayesian networks (Naïve baize) | 83.4 | 80.33 |
The results of all the evaluations indicate that decision trees perform better than Bayesian Networks (Naive Bayes), as shown in Figure 15.

Figure 15: Analysing the performance of Bayesian networks (Naive Bayes) and decision trees
Final conclusion
Numerous data mining techniques exist today, each producing a different result with varying precisions; therefore, selecting the appropriate methodology can enhance the accuracy and completeness of the analysis. Choosing the most appropriate data mining techniques depends on the type of data to be analysed. It is important to note that data play a more significant role and importance in specific fields, including healthcare and cancer research. However, analysing sensitive data, such as cancer research, can be challenging if incomplete information is available. Lymphoma cancer is a problematic diagnosis due to the frequency of contributing factors and the lack of comprehensive information based on the patient's symptoms. There are two types of lymphoma cancer, Hodgkin's disease and non-Hodgkin's disease. This article will evaluate two data mining techniques, the Bayesian Networks (Naive Bayes), and the decision tree, using accuracy, sensitivity, f-score, and error ratio criteria. Also, this article selected tumour markers based on a commonality between two types of lymphoma cancer, including CD3, CD15, CD20, CD30, and LCA, as variables along with the type and gender of lymphoma cancer. To determine whether lymphoma cancer diagnosis factors positively impact lymphoma cancer diagnosis, we have taken into account the highest level of accuracy when determining which factor is most effective in diagnosing lymphoma cancer. Based on the implementation and evaluation of techniques, the decision tree method outperformed the Bayesian Networks (Naive Bayes) technique with an accuracy of 82.66%, a sensitivity of 94.98%, an accuracy of 85.36%, and a harmonic mean of 85.36%. In addition, our research indicates that CD3 and CD15 tumour markers and gender properties do not influence lymphoma cancer diagnosis. It is possible to identify non-Hodgkin's lymphoma using CD20 and LCA markers, while Hodgkin's lymphoma using CD30 markers.
References
- Padhy N, Mishra D, Panigrahi R. The survey of data mining applications and feature scope. arXiv prepr. 2012.
- Wu X, Zhu X, Wu GQ, Ding W. Data mining with big data. IEEE. 2013; 26:97-107.
- Usama M, Renner L. Advances in knowledge discovery and data mining.
- Ng RT, Pei J. Introduction to the special issue on data mining for health informatics. ACM SIGKDD Explor. Newsl. 2007; 9:1-2.
- Glover S, Rivers PA, Asoh DA, Piper CN, Murph K. Data mining for health executive decision support: an imperative with a daunting future!. Health Serv Manag Res. 2010 Feb;23(1):42-6.
- Soni J, Ansari U, Sharma D, Soni S. Predictive data mining for medical diagnosis: An overview of heart disease prediction. Int J Comput Appl. 2011;17:43-48.
- Gharehchopogh FS, Molany M, Mokri FD. Using artificial neural network in diagnosis of thyroid disease: a case study. Int J Comput Sci Appl. 2013; 3:49-61.
- Wu X, Kumar V, Ross Quinlan J, Ghosh J, Yang Q, et al. Top 10 algorithms in data mining. Knowledge and information systems. 2008; 14:1-37.
- Delen D, Walker G, Kadam A. Predicting breast cancer survivability: a comparison of three data mining methods. Artif Intel Med. 2005; 34:113-127.
- Maroco J, Silva D, Rodrigues A, Guerreiro M, Santana I, et al. Data mining methods in the prediction of Dementia: A real-data comparison of the accuracy, sensitivity and specificity of linear discriminant analysis, logistic regression, neural networks, support vector machines, classification trees and random forests. BMC Res Notes. 2011; 4:1-4.
- Sokolova M, Japkowicz N, Szpakowicz S. Beyond accuracy, F-score and ROC: a family of discriminant measures for performance evaluation. Australas Jt Conf Artif Intell. 2006; 1015-1021.
- Chen MC, Liao HC, Huang CL. Predicting breast tumour via mining DNA viruses with decision tree. IEEE; 5: 3585-3589.
- Ghorbian M. Investigating the impact of key tumour markers to predict and reduction of lymphoma cancer diagnosis duration with a data mining approach.
- Anisha PR, Reddy CK, Prasad LN. A pragmatic approach for detecting liver cancer using image processing and data mining techniques. Int. Conf Signal Process Commun Eng Syst IEEE. 2015; 352-357.
- Yasodha P, Ananthanarayanan NR. Analysing big data to build knowledge based system for early detection of ovarian cancer. Indian J Sci Technol. 2015;8:1.
- Kalaiselvi C, Nasira GM. Prediction of heart diseases and cancer in diabetic patients using data mining techniques. Indian J Sci Technol. 2015; 8:1.
- Ghorbian M. Investigating the impact of key tumour markers to predict and reduction of lymphoma cancer diagnosis duration with a data mining approach.
- Ojha U, Goel S. A study on prediction of breast cancer recurrence using data mining techniques. 7th Int Conf Cloud Comput Data Sci Eng-Conflu IEEE. 2017; 527-530.
- Lavanya D, Rani KU. Ensemble decision tree classifier for breast cancer data. Int J Inf Technol Converg Serv. 2012;2:17-24.
- Lucas P. Bayesian analysis, pattern analysis, and data mining in health care. Curr Opin Crit Care. 2004; 10:399-403.
- Witt O, Deubzer HE, Milde T, Oehme I. HDAC family: What are the cancer relevant targets?. Cancer Lett. 2009;277:8-21.
- Tapak L, Mahjub H, Hamidi O, Poorolajal J. Real-data comparison of data mining methods in prediction of diabetes in Iran. Healthc Inform Res. 2013; 19:177-185.
- Sharma A, Kaur B. A research review on comparative analysis of data mining tools, techniques and parameters. Int J Adv Res Comput Sci. 2017;8.
- Chimieski BF, Fagundes RD. Association and classification data mining algorithms comparison over medical datasets. J Health Inform. 2013; 5.

