Research Article - Onkologia i Radioterapia ( 2023) Volume 17, Issue 9
The efficiency of standard uptake value in Pet /CT scan to evaluate the malignant adrenal mass in oncology patients
Maryam M. Amer* and Nadiya Y. MohammedMaryam M. Amer, Physiology Department /Medical Physics Unit, College of Medicine, University of Baghdad, Iraq, Email: miriam1995amir@yahoo.com
Received: 12-Jun-2023, Manuscript No. OAR-23-102073; Accepted: 05-Sep-2023, Pre QC No. OAR-23-102073 (PQ); Editor assigned: 18-Jul-2023, Pre QC No. OAR-23-102073 (PQ); Reviewed: 25-Aug-2023, QC No. OAR-23-102073 (Q); Revised: 01-Sep-2023, Manuscript No. OAR-23-102073 (R); Published: 15-Sep-2023
Abstract
This study is aimed to evaluate the malignant adrenal mass existing in the both sides of the body using the Standard Uptake Value (SUV), 2D activity mass and 3D activity mass of adrenal gland. Materials and Methods: This study included 47 patients who had adrenal mass diagnosed by a physician specializing in nuclear medicine. Prior to the PET/ CT scan, patients were asked to adhere to certain fasting procedures, which include abstaining from carbohydrates and sweets for 12 hours and abstaining from meals for 6 hours, with the exception of water. In addition, patients were instructed to reduce strenuous activity and to discontinue insulin therapy. The SUV was evaluated by making an elliptical Region of Interest (ROI), a minimum of two thirds of the adrenal mass on the fused PET/CT image. Three-dimensional and two-dimensional adrenal mass activity was investigated as physical variables in this research. Results: There was no statistically significant difference between the right and left malignant adrenal mass for the three parameters, adrenal mass activity in 2-dimensions (2D), adrenal mass activity in 3- dimensions (3D) and the maximum Standardized Uptake Values (SUV). The 3D and 2D adrenal mass activity of the right malignant mass was greater than that of the left mass. Statistical results revealed a significant negative association between the injected dose and adrenal mass activity in a 3D in the right adrenal gland. In contrast, the results of this study revealed no significant association between activity mass of adrenal gland in the both sides and the maximum standard uptake value. In addition to the proportion of left adrenal mass, there was a strong positive correlation between 2D and 3D adrenal mass activity identified with the dose injected with FDG-18. Consistently, the data revealed no correlation between the SUV value of left adrenal mass and the injected dose. Conclusion: Positron Emission Tomography (PET/CT) can enhance the diagnosis of the malignant adrenal mass on both sides of the body. The right malignant activity and the SUV standard uptake value are higher than the left affected by the injected dose of FDG-18.
Keywords
PET, SUV, malignant adrenal mass, adrenal Activity, FDG-18
Introduction
The steroid hormone-producing cortex and the catecholaminesynthesizing medulla make up the adrenal glands, a composite endocrine organ. Different types of proliferative lesions may develop in each of these sub-environments. Up to 5% of people who get CT tests for reasons unrelated to adrenal insufficiency are found to have mass lesions of varied sizes, thanks to advances in imaging technology [1].
Most accidentally found tumors (incidentalomas) are benign and do not affect normal function. Malignant tumors and lesions that provide a purpose may both be classified as incidentalomas, which can originate in the cortex or the medulla. Functional adrenal lesions are further subdivided from nonfunctional adrenal lesions using clinical diagnostic and biochemical examination [2].
Positron Emission Tomography (PET) is an imaging modality that, unlike conventional methods, may investigate molecular aspects of adrenal lesions in addition to their morphologic appearance. Knowledge of the normal appearance of the adrenal glands in FDG. PET is essential for accurate diagnosis of abnormal diseases. The size of the adrenal glands makes PET imaging impossible. Furthermore, physiological adrenal FDG absorption is typically not distinguishable from normal background activity [3].
Whole-body Positron Emission Tomography (PET) using 18-fluorodeoxyglucose (18-FDG) can effectively identify malignant adrenal lesions. Extensive studies have been conducted on the effectiveness of 18-FDG PET in detecting lung cancer, and it has proven to be highly accurate in distinguishing benign no inflammatory lesions from malignant tumors. These studies have demonstrated a 100% sensitivity and specificity for the diagnosis of malignant adrenal masses when CT or MRI reveal enlarged adrenal glands or a focal mass [ 4].
The maximal Standardized Uptake Value (SUV) of healthy adrenal glands was found to be between 0.95 and 2.46 in research conducted by Bagheri and colleagues in 2004. Maximum SUV and mean SUV were determined to be 0.90 ± 0.15 and 0.83 ± 0.17 for the right adrenal gland and 1.10 ± 0.15 and 0.946 ± 0.15 for the left adrenal gland, respectively. When FDG absorption in the adrenal glands is more intense than that in the liver, it is often attributed to malignant disease. Given that the typical mean SUV of normal liver tissue is between 1.5 and 2.0, physiologic adrenal uptake may in certain situations be in the range of malignant lesions [5].
This study aimed to assess the malignant adrenal masses in both sides of the body in patients underwent to PET/CT scan using Standardized Uptake Values (SUV) after the injection with Fluoro-Deoxy-Glucose (FDG)-18.
Materials and Methods
This study was conducted at the PET/CT scan unit of the radiation therapy and nuclear medicine departments in Baghdad Center and Al-Andalus Specialist Hospital. This study aimed to differentiate between right and left malignant adrenal mass in 47 patients diagnosed with adrenal gland tumors by a nuclear medicine physician. Prior to PET/CT scanning, patients fasted for 12 hours from carbohydrates and sugars and 6 hours from food, and refrain from physical exercise and insulin use.
A low-dose CT protocol was used to perform CT scanning, after the intravenous administration of 0.1 mCi of 18F-FDG per kilogram of body weight for all patients. Following a 45 minute–60 minute waiting period after 18F-FDG administration, PET/CT scanning was performed. Semi-automated calculations were used to determine the SUVmax values in the adrenal regions by The SUV was evaluated by making an elliptical Region of Interest (ROI), a minimum of two thirds of the adrenal mass on the fused PET/CT image.
The Statistical Packages for Social Sciences- version 25 (SPSS-25) software was utilized for data analysis. The date were expressed as percentage, mean, standard deviation, and range (minimummaximum values). The Student's t-test for two independent means or the paired t-test for paired observations were used to determine the significant difference between means values the for quantitative data. Pearson correlation was employed to examine the relationship between parameters. The significant difference is expressed at P ≤ 0.05
Results
The results included the patients that were only diagnosed with malignant adrenal mass. The data were expressed with mean ± standard deviation, (Table 1). The statistical analysis showed no significant difference between left and right malignant adrenal mass for the three parameters: the Adrenal mass activity in 3 Dimensions (MBq), adrenal mass activity in 2 Dimensions (MBq), and the maximum Standard Uptake Values (SUV) (MBq/ml), as shown in Figures 1-3. The mean values of the right malignant had a higher 3D and 2D adrenal consumption mass activity than the mass at left side with no significant difference.
Tab. 1. Comparison of the 2D Adrenal mass activity, 3D Adrenal mass activity, and mean SUV values in patients with malignant mass at both sides
| Adrenal mass activity 3D | 6.99 ± 1.58 | 7.41 ± 3.05 | 0.7848 |
| Adrenal mass activity 2D | 335.93 ± 134.11 | 338.63 ± 123.67 | 0.9656 |
| max Adrenal SUVs | 5.2 ± 1.47 | 5.33 ± 3.68 | 0.9292 |
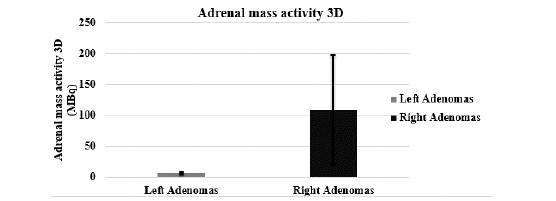
Figure 1: The comparison of adrenal mass activity in 3d (MBq) between the left and right malignant for the patients with both side mass.
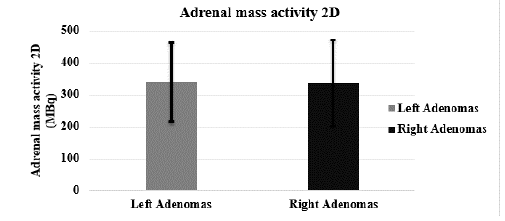
Figure 2: The comparison of adrenal mass activity in 2d (MBq) between the left and right malignant for the patients with both side mass
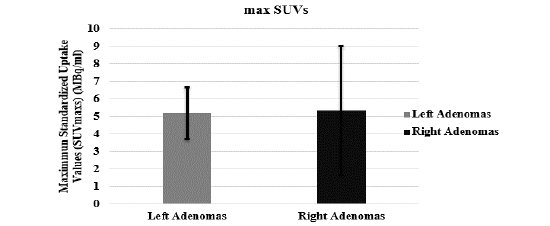
Figure 3: The comparison of the maximum standard uptake values for the malignant adrenal gland in both sides left and right of the patient
A correlation test was achieved to analyse the results between the ID of the FDG-18 (301.045 ± 47.67) and the three studied parameters of the patient 2D, 3D, and SUV affecting the PET/CT image quality. The statistical results were illustrated a significant inverse correlation between the ID and the 3 D of adrenal mass activity for the right malignant.
In contrast, the results of this study depicted no significant correlation with the 2D Adrenal mass activity or maximum SUV for the right-side malignant. While for the left side malignant, showed a significant positive correlation between 2D and 3D Adrenal mass activity with the ID of FDG-18. Constantly, the results showed no significant relation between the left side SUV value and ID (Table 2).
Tab. 2. Correlation of the 2D Adrenal mass activity, 3D Adrenal mass activity 3D, and mean SUVs values for the malignant adrenal gland in both sides left and right of the patient
| r | p-value | r | p-value | |
|---|---|---|---|---|
| Adrenal mass activity 3D (MBq) | -0.5498 | 0.01587* | 0.3319 | 0.05* |
| Adrenal mass activity 2D (MBq) | -0.3117 | 0.45338 | 0.3914 | 0.024453* |
| Max Adrenal SUVs (MBq/ml) | -0.3599 | 0.38247 | -0.0862 | 0.63416 |
Discussion
In this study, patients with malignant masses on both sides (left and right) demonstrated a relation between the administered dosage of FDG-18 and the adrenal mass activity in three dimensions (MBq), adrenal mass activity in two dimensions (MBq), and the maximal Standard Uptake Values (SUV) (MBq/ml).
For the right malignant, there was a strong negative association between the administered dosage and the Adrenal mass activity in 3 Dimensions (MBq). There was no link between the right-sided adenomas and the 2D Adrenal mass activity or maximal SUV. For the adenomas on the left side, a substantial direct association was discovered between 2D, and 3D Adrenal mass activity and the dosage of FDG-18 administered. No major findings were discovered for the left SUV.
Recently compared SUV readings from 75 healthy adrenal tissue samples to those from 100 malignant adrenal (72 lipid rich, 29 lipid deficient) [6]. Researchers determined that an SUV cut-off value of 3.1 best distinguished benign from malignant, with a sensitivity of 98.5% and a specificity of 92.5%, based on their data. SUV cut-off in combination with ROI measurement of _10 HU increased sensitivity to 100% and improved specificity to 98%. Through the technique of fused PET/CT, Blake et al. (2006) compared the SUVs and activity of 32 adrenal tumors to those of 9 non- malignant. Thirty of the 32 adrenal tumors were classified as benign, with activity levels lower than those of the liver. Both PET and unenhanced CT revealed abnormalities in both adrenal glands, but adrenal-specific CT imaging confirmed that the masses were benign adenomas. All 19 of the benign adrenal masses (>10 HU on unenhanced CT) had FDG activity that was less than that of the liver, according to Blake et al. findings. Eleven adrenal tumors were found to have diffuse activity but very low absorption on non-enhanced CT. Maximum SUVs were found to be significantly higher in malignant than benign adrenal tumors (range, 2.3-26.1 vs. 0.5-3.3). Seven otherwise innocuous tumors tested positive for malignancy due to elevated SUVs.
Our study findings were similar to those reported [7], indicating that qualitative assessment is more effective than Standardized Uptake Value (SUV) data in distinguishing benign from malignant disease. However, the extent of difference between quantitative and qualitative results was not as significant in our study as observed in the study by Caoili and colleagues. Our current qualitative results are consistent with those from our prior smaller study [8], which demonstrated a sensitivity and specificity of 100% and 94%, respectively, for the technique in discriminating benign from malignant disease. Unfortunately, the lack of qualitative analysis in the study conducted [6], precludes any understanding of how this information might have influenced the evaluation of the 175 lesions in their study
The suboptimal performance of Standardized Uptake Value (SUV) data observed in the study is perplexing considering that earlier publications suggested its utility [9], albeit not as effective as qualitative analysis. Nevertheless, researchers have cautioned against the routine use of SUVs due to the substantial variability introduced by various factors, including but not limited to body habitus and composition, time elapsed between injection and imaging, differing plasma glucose concentrations, diverse image reconstruction methods, and partial volume effects. Additionally, the mean SUV can be significantly influenced by the size, shape, and location of the Regions of Interest (ROIs), while the maximum SUV can be significantly affected by the reconstruction technique and image noise level [10,11].
Given that the mean and maximum SUV may not be essential for normal usage [11], the three PET/CT studies that compared qualitative and quantitative methods all concluded that the qualitative method was more effective. High qualitative test accuracy has been reported before using PET-only scanners.
Limitations
This research has certain caveats. Before anything else, this was a retrospective analysis, but to the best of our knowledge it is the biggest study to date assessing the quantitative and qualitative usefulness of PET/CT in distinguishing benign from malignant adrenal tumors. However, serial CT scans taken every 6 months are currently the standard for evaluating whether adrenal tumors are benign or malignant.
Second, we did not include contrast-enhanced washout CT examinations, which have also been demonstrated to be extremely beneficial for differentiating benign from malignant lesions, within 3 months of the PET/CT research. Although most researchers do not include CT washout tests as part of the PET/CT scan. Therefore, if an adrenal mass is still ambiguous after PET/CT, these procedures may be carried out as a stand-alone investigation later.
Conclusion
We concluded that the PET/CT has the potential to aid in the diagnosis of cancer and the selection of effective treatments for patients. 18-FDG-PET should be part of the initial examination of a malignant adenoma, allowing the staging of the disease. The activity and SUV of the right adenoma are shown to be greater than those of the left, and this difference is dependent on the amount of FDG-18 that was injected.
Author Declaration
Conflicts of Interest
None.
We hereby confirm that all the Figures and Tables in the manuscript are mine/ ours. Besides, the Figures and images, which are not mine /ours, have been given permission for re-publication attached with the manuscript. Authors sign on ethical consideration’s approval.
Ethical clearance
The project was approved by the local ethical committee in AlAndalus Specialist Hospital according to the code number (1757 in 2021-12-13).
Author contributions
Maryam Amer M. is researcher and Nadiya Y. Mohammed is supervisor.
References
- Young Jr WF. The incidentally discovered adrenal mass. N Engl J Med. 2007, 8;356:601-610.
[Google Scholar][Cross Ref]
- Vaidya A, Hamrahian A, Bancos I, Fleseriu M, Ghayee HK. The evaluation of incidentally discovered adrenal masses. Endocr. Pract. 2019;25:178-192.
[Google Scholar][Cross Ref]
- Gallamini A, Zwarthoed C, Borra A. Positron emission tomography (PET) in oncology. Cancers. 2014;6:1821-1889.
[Google Scholar][Cross Ref]
- Stone WZ, Wymer DC, Canales BK. Fluorodeoxyglucose-positron-emission tomography/computed tomography imaging for adrenal masses in patients with lung cancer: Review and diagnostic algorithm. J Endourol. 2014; 28. .[Google Scholar][Cross Ref]
- Bagheri B, Maurer AH, Cone L, Doss M, Adler L. Characterization of the normal adrenal gland with 18F-FDG PET/CT. J Nucl Med. 2004;45:1340-1343..
[Google Scholar][Cross Ref]
- Metser U, Miller E, Lerman H. 18F-FDG PET/CT in the evaluation of adrenal masses. J Nucl Med. 2006; 47:32-37.
[Google Scholar][Cross Ref]
- Blake MA, Slattery JM, Kalra MK. Adrenal lesions: characterization with fused PET/CT image in patients with proved or suspected malignancy—initial experience. Radiology. 2006;238:970-977.
[Google Scholar][Cross Ref]
- Caoili EM, Korobkin M, Francis IR. Adrenal masses: characterization with combined unenhanced and delayed enhanced CT. Radiology. 2002;222(3):629-633..
[Google Scholar][Cross Ref]
- Caoili EM, Korobkin M, Brown RK, Mackie G, Shulkin BL. Differentiating adrenal adenomas from nonadenomas using 18F-FDG PET/CT: quantitative and qualitative evaluation. Acad Radiol. 2007; 14:468-4675.
[Google Scholar][Cross Ref]
- Thie JA. Understanding the standardized uptake value, its methods, and implications for usage. J Nucl Med. 2004; 45:1431-1434.
[Google Scholar][Cross Ref]
- Boellaard R, Krak NC, Hoekstra OS, Lammertsma AA. Effects of noise, image resolution, and ROI definition on the accuracy of standard uptake values: a simulation study. J Nucl Med. 2004; 45:1519-1527.
[Google Scholar][Cross Ref]
