Research Article - Onkologia i Radioterapia ( 2023) Volume 17, Issue 4
The Physical Parameters Variation Related to the Standard Uptake Value and Mass Activity in the Benign and Malignant Adrenal gland
Maryam Amer M* and Nadiya Y MohammedMaryam Amer M, Department of Physiology, College of medicine, University of Baghdad, Iraq, Email: miriam1995amir@yahoo.com
Received: 20-Mar-2023, Manuscript No. OAR-23-92488; Accepted: 10-Apr-2023, Pre QC No. OAR-23-92488(PQ); Editor assigned: 23-Mar-2023, Pre QC No. OAR-23-92488(PQ); Reviewed: 06-Apr-2023, QC No. OAR-23-92488(Q); Revised: 09-Apr-2023, Manuscript No. OAR-23-92488(R); Published: 12-Apr-2023
Abstract
Background: This study is to evaluate the benign and malignant of adrenal mass using physics parameters of standard uptake value and mass activity through pet/CT scan.
Materials and Methods: The study involved 47 patients which were diagnosed with adrenal gland tumors by a nuclear medicine physician. Before the PET/CT scan, patients must adhere to specific fasting protocols, including abstaining from carbohydrates and sugars for 12 hours and from food for 6 hours. However, they were being permitted to consume water. Patient is injected intravenously by 18-FDG with 0.1 mci per kilogram of body weight. The volume of interest (VOI) and Region of interest (ROI) was determined manually or semi-automatically. The physics parameters used in this study are Adrenal Mass Activity 3D and 2D (MBq), Adrenal Max SUVs (MBq/ml)
Results: According to the Pet /CT scan image, blood test and adrenal biopsy, the patients were divided into two groups based on tumor type: 38 patients had malignant, and nine were benign. Patients in benign and malignant groups showed no significant differences in age, gender, height, weight, BMI, glucose level, fasting duration, and FDG-18 dose. The Adrenal Mass Activity 3D (MBq) for the malignant group was significantly higher than the benign group, and the maximum adrenal standard uptake values (SUV) were significantly higher. A correlation test was conducted between the injected Dose (ID in MBq) of FDG-18 and the three parameters: 3 Dimensions, Adrenal mass activity in 2 Dimensions (MBq), and the maximum standard uptake values (SUV) (MBq/ ml). The analysis showed no significant correlation between the ID and the 3 Dimensions, 2 Dimensions, or SUV for both malignant and benign.
Conclusions: The variation in standard uptake value and activity of FDG-18 can be added as a physical parameter to differentiate between benign and malignant in adrenal mass diagnostic.
Keywords
PET, SUV, adenoma, Activity, FDG-18
Introduction
Breast cancer is the most common type of Positron Emission Tomography (PET) is a nuclear imaging technique it uses the unique decay characteristics of radionuclides that decay by positron emission [1]. PET provides molecular imaging of biological function instead of anatomy [2]. The tagged substance is injected into the body, typically intravenously, and is dispersed throughout tissues according to its biochemical characteristics. A positron is released from the nucleus when the radioactive atom on a particular molecule decay, which ultimately results in the emission of high-energy photons that have a good chance of fleeing the body (1). Fluoro-Deoxy-Glucose (FDG) is a positronemitting radiopharmaceutical [3]. Understanding the biology of cancer is now possible due to the importance of glucose metabolism in malignancy. FDG's striking similarity to glucose's behavioral characteristics is a significant benefit in cancer imaging. Take glucose metabolism, which occurs in almost every organ. FDG uptake is very sensitive to the interplay between regional variables and metabolic activity at the tissue, organ, and wholebody levels .
18F-fluoro-2-deoxy-D-glucose (FDG) PET has been proven to be very sensitive in identifying adrenal metastases, with results showing 19%-34% more metastatic foci than conventional imaging approaches [4]. However, some researchers observed that benign adrenal adenomas displayed fluctuating activity, leading to false-positive diagnoses for malignancy [5–7], suggesting that 18F-FDG PET may not help diagnose benign adrenal lesions. In addition, these previous investigations utilized varying diagnostic criteria, comparing adrenal mass activity to either background activity or liver activity [8,9].
After intravenous treatment of 18F-FDG, tumor cells exhibit a constant rise in SUV, a quantitative assessment of radioactivity concentrations at a defined time. Several variables influence the SUV, such as the dosage calibration's precision, the time between injection and imaging, the patient's weight, motion artifacts, and lood glucose levels [10]. The clinical value of the SUV can only be realized if there is careful attention to patient preparation, study conduct, and region of interest selection to ensure the SUV is indeed “standardized” in its use from study to study. With such control, the SUV is a valuable adjunct to qualitative image interpretation. The most typical method for determining what the local activity concentration is in a PET image (or volume) is to define a Region of Interest (ROI) on an image using an image analysis software package [11].
Adenomas are the most common benign adrenal neoplasm, found in up to 5% of patients on CT. On a CT scan, adrenal adenomas typically have a homogeneous attenuation and are less than 3 cm in size. On FDG PET, most adenomas demonstrate background FDG avidity [12].
All malignant, benign, and benign non-neoplastic processes are included in the differential diagnosis of adrenal gland lesions. Metastases are by far the most frequent type of adrenal cancer. Additional adrenal malignancies include lymphoma, malignant pheochromocytomas, and adrenal cortical carcinomas. The most common benign adrenal neoplasms are adenomas. Myelolipomas, benign pheochromocytomas, and ganglioneuromas are a few more examples of adrenal neoplasms that are not malignant. Noncancerous processes that may impact the adrenal gland include adrenal hyperplasia, infections, traumatic lesions, and physiologic adrenal fluorodeoxyglucose (FDG) avidity [13].
Evangelista et al. (2022) conducted a study to analyze available data on the use of FDG PET for Primary Adrenal Lymphoma (PAL) and report a small monocentric series of patients [14]. The authors found that PET/CT and PET/MR consistently showed significant FDG uptake in primary adrenal lesions and metastatic locations. Moreover, PET measures were elevated in all primary adrenal tumors, including maximal standardized uptake value (SUVmax) and metabolic tumor volume (MTV). The study concluded that FDG PET paired with either CT or MRI is effective for staging, re-staging, and evaluating therapy response in patients with PAL.
In a separate study, Liu et al. (2019) investigated how well absolute and relative percentage washout ratios (APW and RPW, respectively) determined from a short-time delay triphasic enhanced CT can distinguish between adenomas and nonadenomas. According to the authors, there were statistically significant differences in APW and RPW values between the adenoma and non-adenoma groups [15]. For both APW and RPW, it was claimed that their area under the ROC curve was rather large. Among the three criteria, the RPW (30%) criterion had the best accuracy (86%), followed by the APW (32%), with 81% accuracy, 86% sensitivity, and 69% specificity. Compared to previously reported specialized adrenal CT procedures with more significant time delays, the study suggested that the APW and RPW values from a short time delay triphasic enhanced CT could efficiently and effectively differentiate between adenomas and non-adenomas and could give comparable diagnostic outcomes.
In oncology patients, differentiating benign from malignant adrenal masses is crucial, and PET/CT scans have been shown to be more specific than 18F-FDG PET information alone. Our study aims to distinguish between malignant and benign adrenal masses in patients undergoing PET/CT scans by analyzing the physical factors that affect the calculation of noninvasive standardized uptake values (SUV) after the injection of Fluorodeoxyglucose (FDG)-18.
This study is aimed to evaluate the physics parameters of standard uptake value and mass activity and how much it may add to the differentiation between benign and malignant in patients with adrenal mass using PET/CT scan.
Material and Methods
During the period between November 15, 2021, and June 1, 2022, the study was conducted at the PET/CT scan unit of the radiation therapy and nuclear medicine departments in Baghdad Center and Al-Andalus Specialist Hospital. The study was involved 47 patients who had been diagnosed with adrenal gland tumors by a nuclear medicine physician depending on Pet/CT scan, Blood test, adrenal biopsy. Prior to the PET/CT scan, patients required to fast for 12 hours from carbohydrates and sugars and 6 hours from food was be allowed to drink water. Patients should also be advised to refrain from physical exercise and to stop taking insulin. Clinical information for each patient was recorded.
The PET/CT scan involved the intravenous administration of 0.1 mCi of 18F-FDG per kilogram of body weight for all patients. After a waiting period of 45-60 minutes following 18F-FDG administration, PET/CT scanning was performed using a PET/ CT scanner. A low-dose CT protocol for attenuation map was used to perform CT scanning from the skull base to the upper thigh. PET images of the same area were acquired after CT scanning. Semi-automated calculations were performed using a workstation to determine the values of SUVmax in the adrenal and liver (background) regions by placing Region of Interest (ROI) on the PET/CT images. The volume of interest (VOI) and Region of interest (ROI) were determined manually or semi-automatically.
The data analysis was performed using Statistical Packages for Social Sciences- version 25 (SPSS-25) software. The results were presented as simple measures of percentage, mean, standard deviation, and range (minimum-maximum values). The statistical significance of the difference between means (quantitative data) was evaluated using the Student's t-test for two independent means or the paired t-test for paired observations (or two dependent means). Pearson correlation was employed to investigate the relationship between parameters. Statistical significance was present when the p-value was equal to or less than 0.05.
Results
Table 1 presents the characteristics of the 47 patients enrolled in this study, who were divided into two groups based on tumour type: 38 patients had benign, and 9 patients had malignant. The demographic and clinical characteristics of these patients, including age (in years), gender, height (in meters), weight (in kilograms), BMI (in kg/m2 ), glucose level (in mg/dL), fasting duration, and FDG-18 dose (in MBq), did not show any significant differences between the two groups, except for gender. Specifically, in the benign group, there were 6 females (67%) and 3 males (33%), while in the malignant group, there were 22 males (58%) and 16 females (42%).
Tab. 1. The characteristics of benign and malignant patients.
| Characteristics | Benign | Malignant | P-value |
|---|---|---|---|
| Age (years) | 59.11 ± 10.99 | 63.18 ± 12.54 | 0.34841 NS |
| Gender | Male: 3 (33%) | Male: 22 (58 %) | 0.000385* |
| Female: 6 (67 %) | Female: 16 (42 %) | ||
| Height (m) | 1.60 ± 0.08 | 1.61 ± 0.09 | 0.3834 NS |
| Weight (kg) | 68.33 ± 15.51 | 73.34 ± 13.26 | 0.3902 NS |
| BMI (kg/m2) | 24.87 ± 7.94 | 27.77 ± 5.86 | 0.3289 NS |
| Glucose level (mg/dL) | 108.44 ± 31.31 | 114.32 ± 26.16 | 0.6129 NS |
| Fasting hours | 12 ± 2.31 | 10.51 ± 2.52 | 0.2512 NS |
| FDG-18 (MBq) | 289.83 ± 65.41 | 299.79 ± 42.05 | 0.6723 NS |
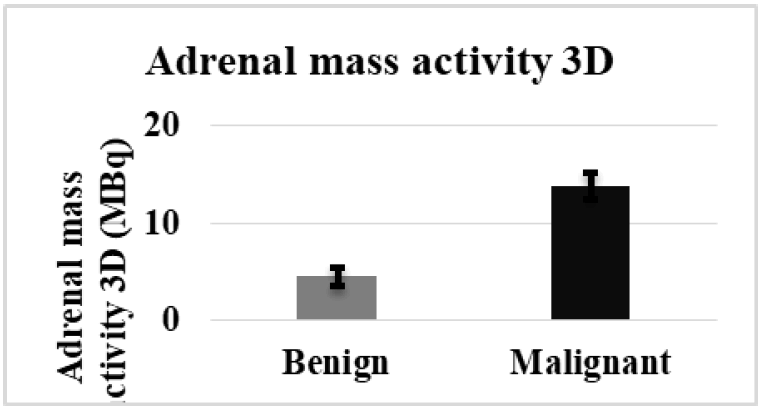
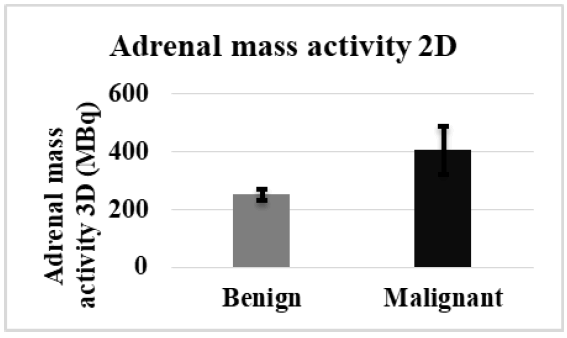
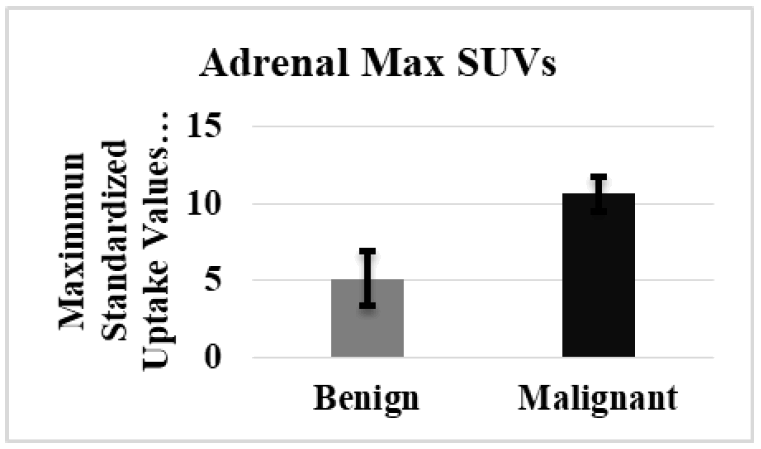
The analysis of data for the patients who had a mass in one side of the adrenal gland is illustrated in the (Table 2). The results included the Adrenal mass activity in 3 Dimensions (MBq), Adrenal mass activity in 2 Dimensions (MBq), and the maximum standard uptake values (SUV) (MBq/ml) of both malignant and benign groups. The Adrenal Mass Activity 3D (MBq) for the malignant group was significantly higher than the benign group (Figure 1). In contrast, in adrenal mass activity 2D (MBq), the results revealed a high significant value in malignant than in the benign group, as shown in (Figure 2). The maximum adrenal standard uptake values (SUV) (MBq/ml) for the malignant group revealed a higher significant mean value as compared with the benign group, (Figure 3).
Tab. 2. Concentration of serum ESR1, EGFR2 and HUMAN VITAMIN D3 in Women with breast cancer compared to healthy women subject.
| No. of individual | Group | ESR1 | EGFR2 | HUMAN VITAMIN D3 |
|---|---|---|---|---|
| Newly diagnosis females | Pre menopause | 1613±57.8%a | 9.780±4.08%a | 1613±57.8%c |
| Post menopause | 1403±42.9%a | 8.417±2.42%ab | 1403±42.9%d | |
| After radiation | Pre menopause | 1607±57.1%a | 10.920±2.51%a | 1607±38.1%bc |
| Post menopause | 1352±41.8%a | 9.520±4.40%a | 1352±41.8%d | |
| Control | Pre menopause | 1322±40.6%c | 5.125±1.12%b | 1722±65.1%a |
| Post menopause | 1301±39.1%c | 5.455±1.45%b | 1701±60.6%ab | |
| P-value | *0.053 | *0.035 | *0.045 |
* Significant difference at p-value ≤ 0.05
Figure 1: Adrenal Mass Activity 3D (MBq) in malignant and benign groups with a Mass in one side.
Figure 2: The Comparison of adrenal mass activity 2D (MBq) in malignant and benign groups with a mass in one side
Figure 3: The Comparison of adrenal maximum standard uptake values (SUV) (MBq/ml) for the malignant and benign groups with a mass in one side.
In order to check the injected dose ID given to patient whether 18 with mean value of (302.47 ± 57.17 MBq) and the three parameters: 3 Dimensions (MBq), Adrenal mass activity in 2 Dimensions (MBq), and the maximum standard uptake values (SUV) (MBq/ml). The correlation results are shown in (Table 3,4). The analysis showed that there was no significant correlation between the ID of FDG-18 and the Adrenal mass activity in 3 Dimensions (MBq), Adrenal mass activity in 2 Dimensions (MBq), and the maximum standard uptake values (SUV) (MBq/ml) for both groups with a mass in one side.
Tab. 3. Comparison of the 2D Adrenal mass activity, 3D Adrenal mass activity 3D, and mean SUVs values for Benign and Malignant patients with one side mass.
| Benign | Malignant | P-value | |
|---|---|---|---|
| Adrenal Mass Activity 3D (MBq) | 4.49 ± 1.01 | 13.85 ± 1.41 | <0.00001* |
| Adrenal Mass Activity 2D (MBq) | 251.95 ± 19.38 | 404.75 ± 82.19 | 0.0379* |
| Adrenal Max SUVs (MBq/ml) | 5.13 ± 1.8 | 10.66 ± 1.45 | 0.0162* |
* Significant difference at p-value ≤ 0.05
Table 4. The 2D Adrenal mass activity, 3D Adrenal mass activity 3D, and mean values of SUVs for both groups’ malignant and benign with a mass in one side.
| Parameters | Benign | Malignant | ||
|---|---|---|---|---|
| r | p-value | r | p-value | |
| Adrenal mass activity 3D (MBq) | -60% | 12% | -15% | 37% |
| Adrenal mass activity 2D (MBq) | 48% | 22% | -22% | 19% |
| Adrenal max SUVs (MBq/ml) | -4% | 93% | 19% | 26% |
Discussion
In 5% of abdomen CT scans, the adrenal tumor is usually identified by accident [16]. These lumps are often benign adenomas, even in people known to have cancer. Despite the possibility that an undiagnosed adrenal mass is a benign lesion, it is necessary to describe the lesion and rule out cancer in order to assure effective care [17]. Patients with cancer who have an adrenal lesion identified must have that lesion characterized in order to establish a primary disease stage. Distinguishing between benign, non-functional adenomas and metastatic disease is the most prevalent clinical challenge. As a result, tests developed to distinguish between these lesions need to be very precise so that a false positive diagnosis of benignity is not made [18]. Washout CT with and without contrast and chemical shift MRI [19–21] are two examples of tests that match these requirements. It should come as no surprise that unenhanced CT attenuation data from dedicated PET/CT can be used to characterize most, if not all, lipid-rich adenomas, as the 10-HU threshold is well-established in clinical practice to distinguish lipid-rich (10 HU) benign adenomas from lipid-poor (>10 HU) indeterminate lesions (some adenomas and most malignant lesions) [22].
In this study, a total of 47 patients were analyzed and grouped based on their tumor type as either adenomas (38 patients) or non-adenomas (nine patients). Patient characteristics including age, gender, height, weight, BMI, glucose levels, fasting duration, and FDG-18 uptake values were collected. The only significant difference observed between the two groups was in gender distribution. The non-adenomas group had a higher proportion of females (67%) than males (33%), while the adenomas group had a higher proportion of males (58%) than females (42%).
This research analysis data for the patients who have a mass in one side of the adrenal gland of both adenomas and non-adenomas groups showed that the adrenal mass activity 3D (MBq) for the adenomas group was significantly higher than the non-adenomas group. In adrenal mass activity 2D (MBq), the non-adenomas group had a significantly higher value than the adenomas group. The maximal standard uptake values (SUV) (MBq/ml) for the non-adenomas group had a greater significant mean value than the adenomas group. In this study, the injected dose (ID) of 18- FDG given to patient shows that there is no significant correlation between the injected dose of FDG-18 and the Adrenal mass activity in 3 Dimensions (MBq), Adrenal mass activity in 2 Dimensions (MBq), and the maximum standard uptake values (SUV) (MBq/ml) for both groups with a mass in one side.
While the PET portion of PET/CT has been well-established, the best way to describe adrenal lesions is still up for dispute. Our study agreed with study, who evaluated 175 adrenal lesions in 150 patients by PET/CT, showed relatively high-test specificity (92%) when quantitative SUV PET data were used (which increased to 98% when CT densitometry was incorporated). On the other hand, in Caoili et al. study of 38 patients, the SUV test specificity to detect malignant disease was only 78% [20]. Similar to our results, SUV test specificity to detect malignant disease was only 75% in a small study in 14 patients. That is in contrast with previous study finding by, Caoili et al. found that the use of the maximum SUV was not helpful in discriminating benign from malignant lesions [23].
Many neoplasms have elevated glucose metabolism, which may be detected by the functional imaging technique 18F-FDG PET. Evidence suggests that adrenal metastases may be distinguished from adenomas using 18F-FDG PET. With the enhanced uptake on 18F-FDG PET of 14 malignant adrenal lesions, adrenal metastasis was detected with a sensitivity and specificity of 100% in a prospective investigation of 24 adrenal masses in patients with known malignancy [24].
Conclusion
In summary, 18F-FDG PET/CT is a dependable non-invasive imaging modality that incorporates established CT attenuation criteria along with meticulous examination of FDG activity. It can effectively differentiate between benign and malignant adrenal masses in patients with suspected cancer who present with unilateral adrenal mass. Additionally, 18F-FDG PET/CT can be employed for the assessment of adrenal masses in patients without malignancy. This approach provides a useful diagnostic tool for evaluating adrenal masses in a non-invasive manner.
References
- Phelps ME. Molecular imaging and its biological applications. Eur J Nucl Med Mol Imaging. 2004; 31:1544.
- Zamrodah Y. PET and PET/CT A Clinical Guide. 15. 2016. 1–23.
- Radioisotopes IA, No RS. Cyclotron Produced Radionuclides: Guidance on Facility Design and Production of [18F] Fluorodeoxyglucose (FDG).
- Mac Manus MP, Hicks RJ, Matthews JP, Hogg A, McKenzie AF et al. High rate of detection of unsuspected distant metastases by PET in apparent Stage III non–small-cell lung cancer: implications for radical radiation therapy. Int J Radiat Oncol Biol Phys. 2001; 50:287-93.
- Lee JM, Kim MK, Ko SH, Koh JM, Kim BY et al. Clinical guidelines for the management of adrenal incidentaloma. Endocrinology and Metabolism. 2017; 32:200-18.
- Koç ZP, Ozcan PP, Sezer E, Eser K, Kara T. The F-18 FDG PET/CT evaluation of the metastatic adrenal lesions of the non-lung cancer tumors compared with pathology results. Egypt J Radiol Nucl Med. 2022; 53:16.
- Yun M, Kim W, Alnafisi N, Lacorte L, Jang S et al. 18F-FDG PET in characterizing adrenal lesions detected on CT or MRI. J Nucl Med. 2001; 42:1795-9.
- Metser U, Miller E, Lerman H, Lievshitz G, Avital S et al. 18F-FDG PET/CT in the evaluation of adrenal masses. Journal of Nuclear Medicine. 2006;47(1):32-7.
- Park BK, Kim CK, Kim B, Choi JY. Comparison of delayed enhanced CT and 18F-FDG PET/CT in the evaluation of adrenal masses in oncology patients. J comput assist tomogr. 2007; 31:550-6.
- Wiyaporn K, Tocharoenchai C, Pusuwan P, Ekjeen T, Leaungwutiwong S et al. Factors affecting standardized uptake value (SUV) of positron emission tomography (PET) imaging with 18F-FDG. J Med Assoc Thail. 2011 ;93:108.
- Wahl RL. Principles and practice of PET and PET/CT. Wagner HN, Beanlands RS, editors. Philadelphia: Lippincott Williams & Wilkins; 2009.
- Park JJ, Park BK, Kim CK. Adrenal imaging for adenoma characterization: imaging features, diagnostic accuracies and differential diagnoses. Br J Radiol. 2016; 89:20151018.
- Zamrodah Y. Fundamentals of Oncologic PET/CT.15. 2016. 1–23.
- Evangelista L, Crimì F, Visentin A, Voltan G, Trentin L, Lacognata C, et al. [18F]FDG PET/CT and PET/MR in Patients with Adrenal Lymphoma: A Systematic Review of Literature and a Collection of Cases. Curr Oncol. 2022;29(10):7887–99.
- Liu T, Sun H, Zhang H, Duan J, Hu Y et al. Distinguishing adrenal adenomas from non-adenomas with multidetector CT: evaluation of percentage washout values at a short time delay triphasic enhanced CT. Br J Radiol. 20; 92:20180429.
- Al-Thani H, El-Menyar A, Al-Sulaiti M, ElGohary H, Al-Malki A, Asim M, Tabeb A. Adrenal mass in patients who underwent abdominal computed tomography examination. N Am J Med Sci. 2015; 7:212.
- Arnold DT, Reed JB, Burt K. Evaluation and management of the incidental adrenal mass. In Bayl Univ Med Cent Proc. 2003:16, 7-12.
- Sahdev A. Imaging incidental adrenal lesions. Br J Radiol. 2023; 96:20220281.
- Boland GW, Blake MA, Hahn PF, Mayo-Smith WW. Incidental adrenal lesions: principles, techniques, and algorithms for imaging characterization. Radiology. 2008; 249:756-75.
- Caoili EM, Korobkin M, Francis IR, Cohan RH, Platt JF et al. Adrenal masses: Characterization with combined unenhanced delayed enhanced CT. Radiology. 2002; 222.
- Blake MA, Jhaveri KS, Sweeney AT, Sodickson DK, Arellano RS et al. State of the art in adrenal imaging. Curr Probl Diagn Radiol. 2002; 31:67-78.
- Blake MA, Slattery JM, Kalra MK, Halpern EF, Fischman AJ et al. Adrenal lesions: characterization with fused PET/CT image in patients with proved or suspected malignancy—initial experience. Radiology. 2006; 238:970-7.
- Caoili EM, Korobkin M, Brown RK, Mackie G, Shulkin BL. Differentiating adrenal adenomas from nonadenomas using 18F-FDG PET/CT: quantitative and qualitative evaluation. Acad. Radiol. 2007; 14:468-75.
- Kunikowska J, Matyskiel R, Toutounchi S, Grabowska-Derlatka L, Koperski Å, Królicki L. What parameters from 18 F-FDG PET/CT are useful in evaluation of adrenal lesions?. Eur J Nucl Med Mol Imaging. 2014; 41:2273-80.
